Dashboard
Dashboard is an alternative to the current User Web Interface. This is a clearly represented view for monitoring hosts or services in the entire network.
You can enable this view under Configuration > System > Dashboard in the Administration Web Interface
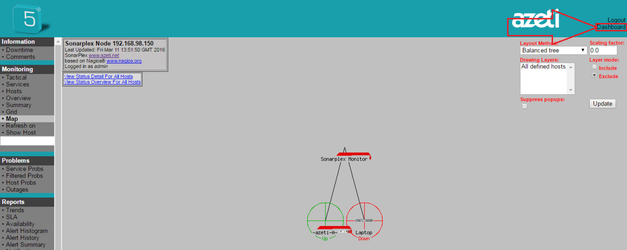
To switch to this view click on “Dashboard” (see picture below) in the user web interface.
If this view is not enabled “Dashboard” will not be displayed.
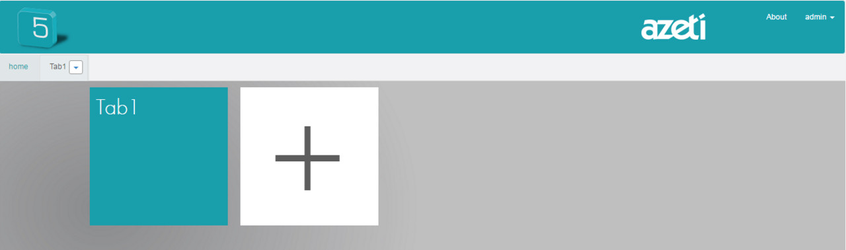
Picture below represents the default view of dashboard. You can add a new tab by clicking on the “plus” icon and following the instructions depends on what you want to view. Create a tab to get a quick summary on a desired host and service.
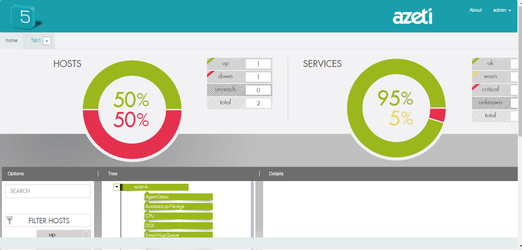
There is another view: The “home” view. This delivers an explicit graphic overview of hosts and services status in the entire network. By clicking on a host or service you can have more details about the selected host or service.
- style