Monitoring
This section describes the "Monitoring" part of the User Web Interface. In this part, it will be generally displayed the status of the monitored hosts and the status of the applied services. This part contains many pages which will described lower. At the most pages you can find on the top the total number of host/service in a specific status (Host Status Totals / Service Status Totals) plus all host/service problems.
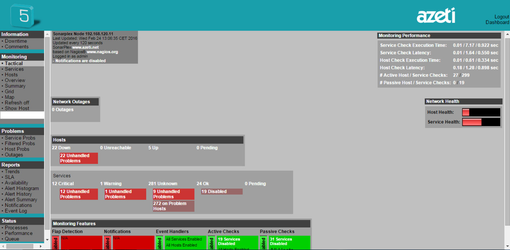
Tactical
Here, it will be listed the number of network outages. By clicking on the linked number you can have more information about this outages. This part lists also the number of hosts/services with their corresponding status (host: Down, Unreachable, Up and Pending, service: Critical, Warning, Unknown, Ok and Pending. The meaning of these status is explained here).
Right down at the bottom, it will be represented which monitoring features (Flap Detection, Notifications, Event Handlers, Active Checks and Passive Checks) are enabled. These monitoring features can be set in Administration Web Interface, see for example How-To Create or Edit a host. This part shows also monitoring performance and host/service health according to the problems which occur on the entire hosts/services.
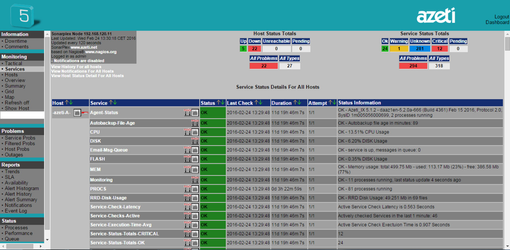
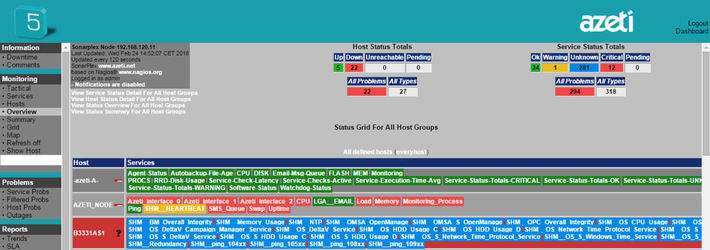
Services
Here it will be listed all hosts and information about the status of their services. For example it will be specified for a host, which services are used in this host, the services status, the last service status check and so on. You can click on a host/service to view more information about its state, to know which available command you can apply on this host/service or to see/add comment relating to this host/service.
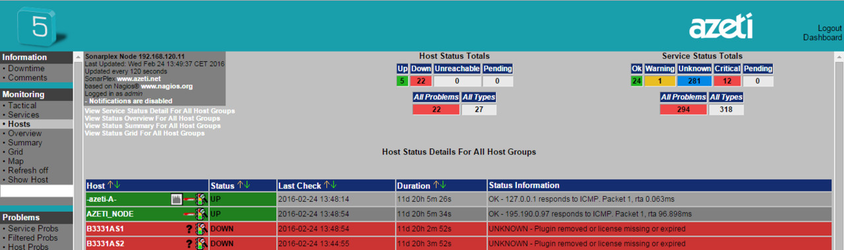
Hosts
Here it will be listed all hosts and their status details. Click on a host for more information about this host. Then you can also add a host comment or execute a host command.
Overview
This part is an overview of all monitoring views. It summarizes the hosts or services status in the entire network. You can switch between the following views:
Service Overview For All Host Groups (Default view): Hosts, their status, the status of their belonging services or available actions are specified here. You can click on a host or a service status to have service status details for the corresponding host.
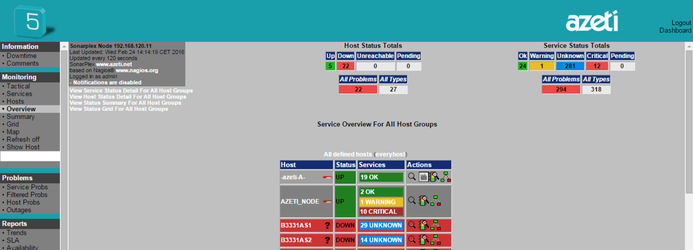
Service Status Details For All Host Groups (see Monitoring::Services)
Status Summary For All Host Groups (see Monitoring::Summary)
Status Grid For All Host Groups (see Monitoring::Grid)
Host Status Details For All Host Groups (see Monitoring::Hosts)
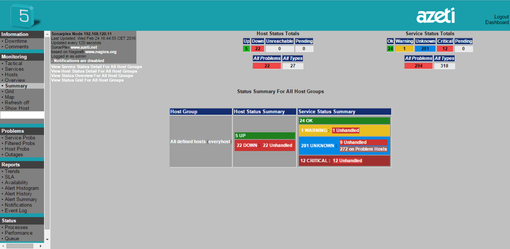
Summary
Here it will be summarized the host/service status for all host groups. It specify for example how many hosts are up or how many services are ok. Click on a (host) group or service to view further details.
Grid
Here it will listed for all host groups, which host are belonged to which host group and which services are available for these hosts. Services are highlighted with the correspondent service status color.
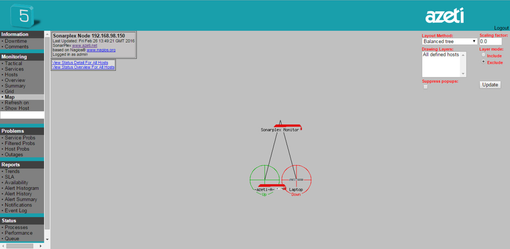
Map
The entire network will be graphed here. The user can configure the layout of the network representation with the command top right.
Refresh off/on
With this command you can refresh all pages in the monitoring web interface.
Show Host
Enter a host name in the search box below and click the enter key to view details about this host.
The search box is case sensitive.
- style