Introduction
One of the strongest tools for troubleshooting issues and verifying configurations is the Admin & Live Table. This guides will show you how to access and use it.
On this page:
Related pages:
Features
The Admin & Live Table works in context of a single location and shows data off this particular location.
Live Table
- display entire collected sensor data for a particular location
- get debug information about states and the evaluation
- use Live Monitoring to see sensor results flowing in live
Admin
- execute and test the configured Actions directly
- show sensor History and Detail Graphs
- get debug information about sensors and their states
Accessing Admin & Live Table
There is more than one way to access it.
- Organization → Locations → Click on the name of the location of interest
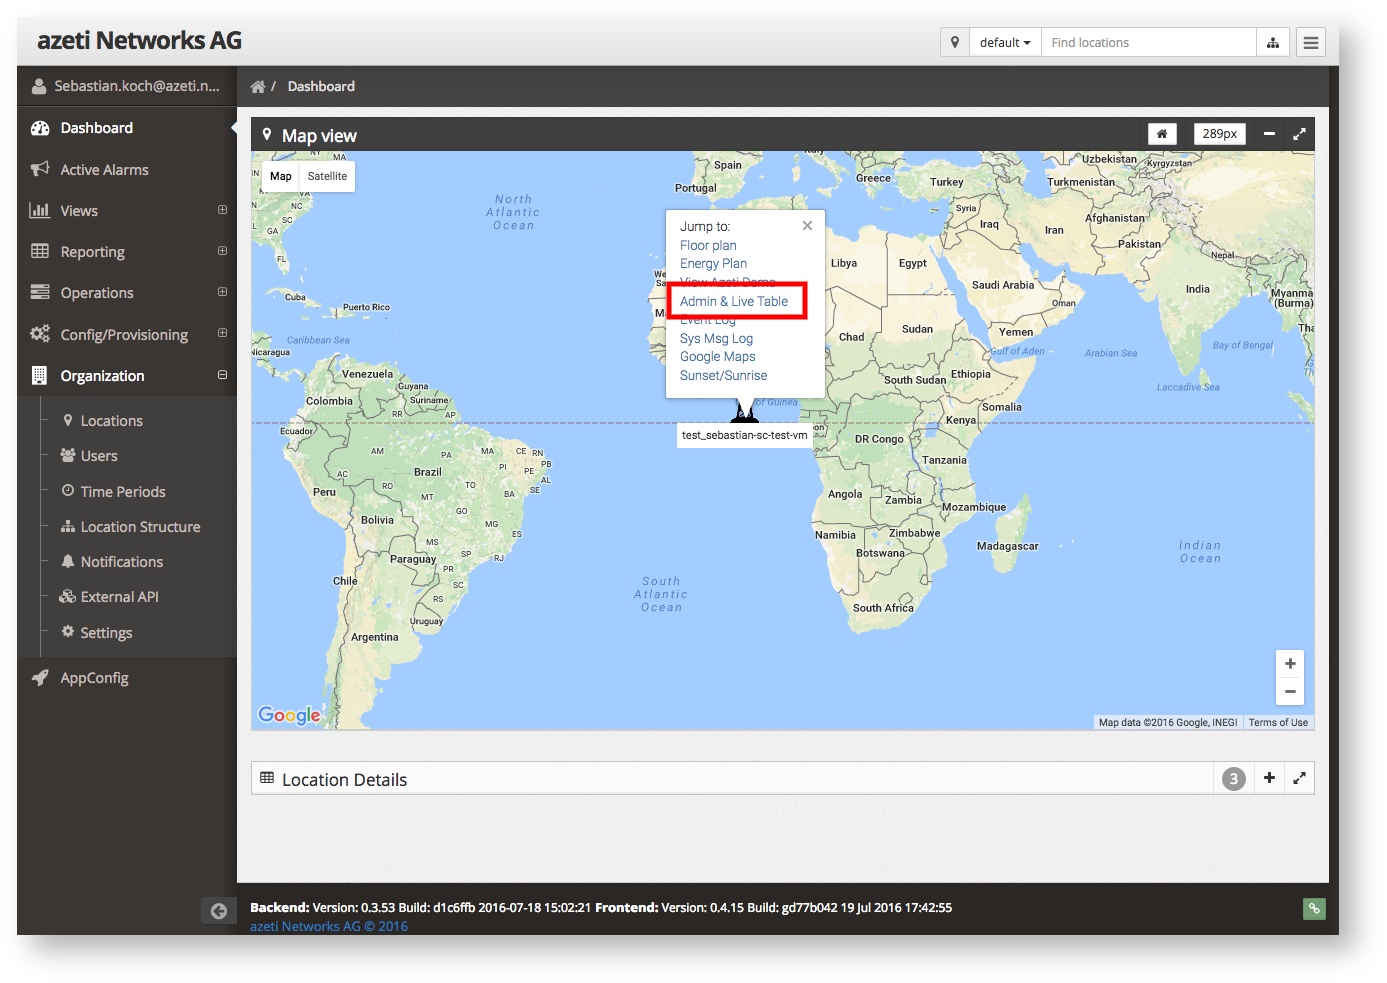
- Dashboard → Map VIew → Click on the icon of the location and choose Admin & Live Table
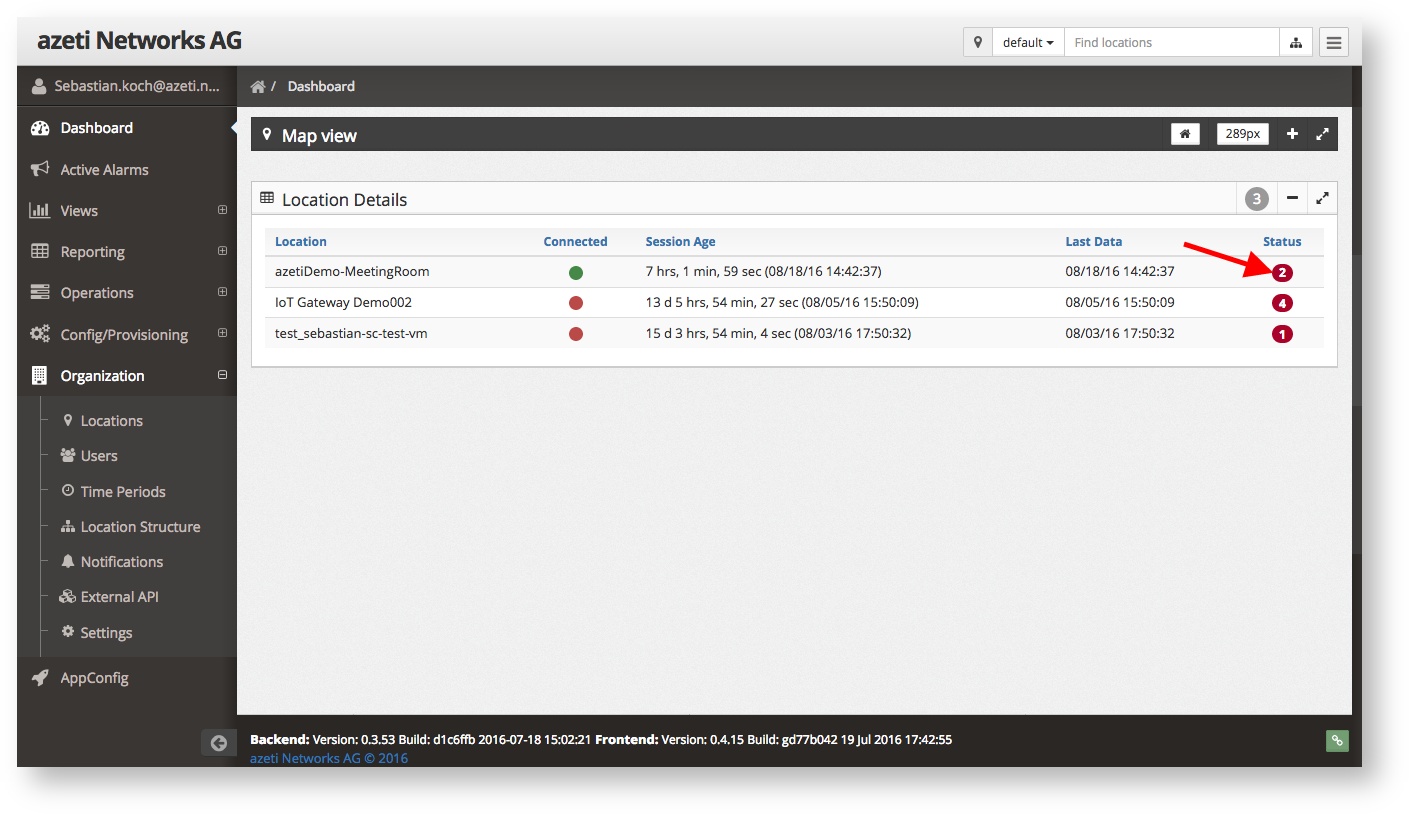
- Dashboard → Location Details → Click on the circle in the Status row
- Open the Location Tree by clicking on
 at the top, choose your location and expand it (+), find Admin & Live Table in the menu
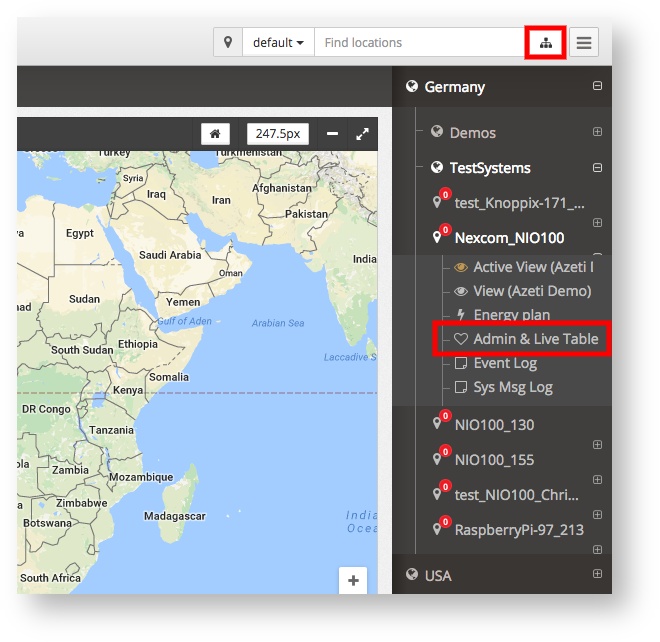
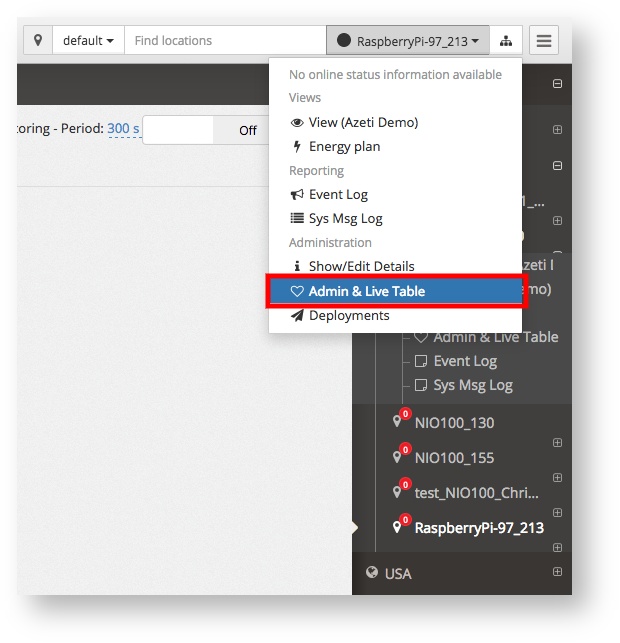
- Search for your location (top search bar) and choose it, open the location menu and choose Admin & Live Table
Usage
Filtering for sensors and values
The Filter function allows you to search in any available metric, e.g. search for states, sensor name or values. Type it in and it refreshes the list automatically.
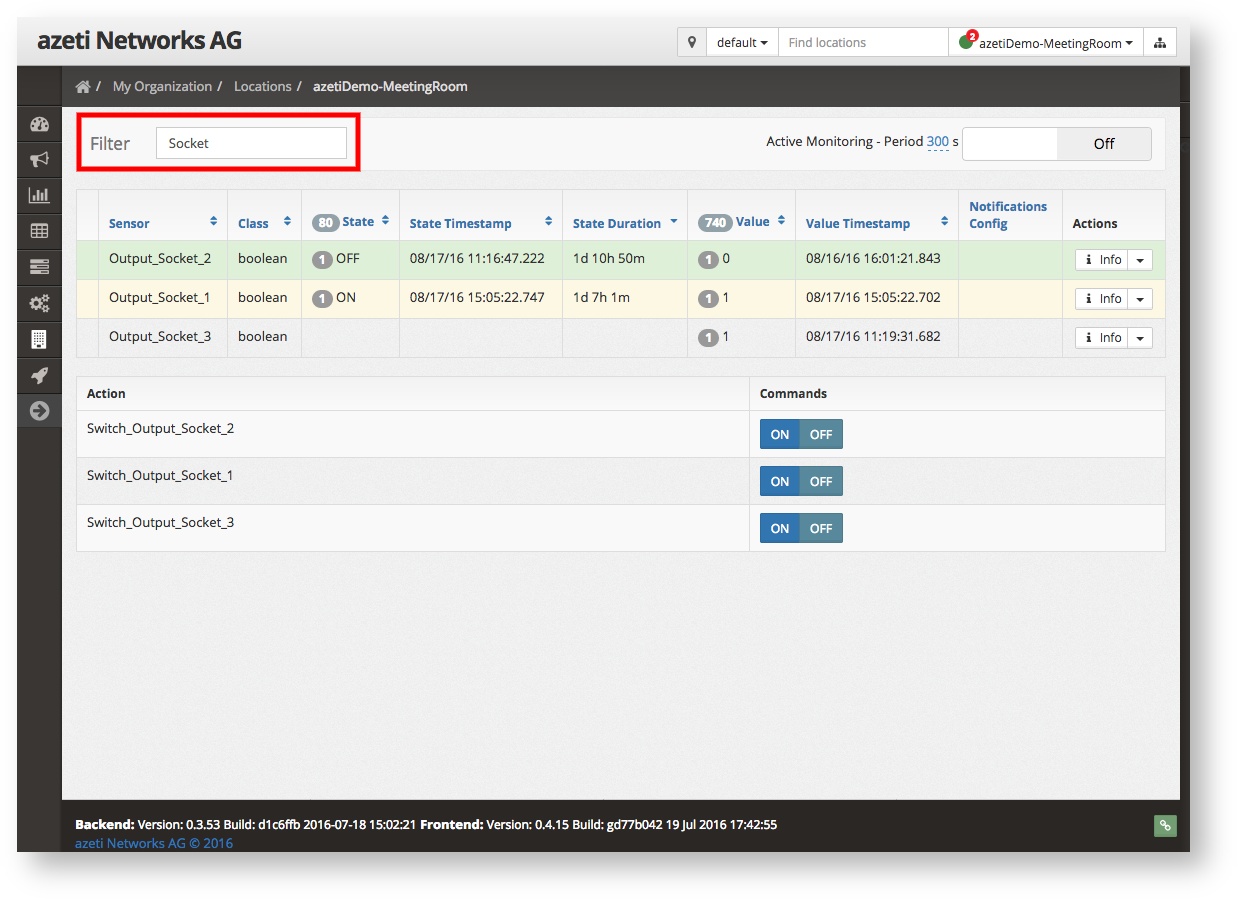
Table field reference
You can sort the Live Table by any row, simply click on the row header.
| Field | Description |
|---|---|
| Sensor | Name of the sensor |
| Class | Sensor class, describes the type of measurement, some examples:
|
| State | Current sensor state e.g. OK |
| State Duration | Elapsed time since this state occured. |
| Value | Measurement result |
Value Duration | Elapsed time since value was processed locally |
| Notifications Config | Configured notifications |