| Section | ||||||||||||||||||||||||||||||
|---|---|---|---|---|---|---|---|---|---|---|---|---|---|---|---|---|---|---|---|---|---|---|---|---|---|---|---|---|---|---|
|
Formatting Guidelines
Parameters are unfortmatted
Paths to directories or files are preformatted /opt/azeti/SiteController/foobar
| Tip | |||||
|---|---|---|---|---|---|
Enclose parameters and paths into double brackets
when typing and Confluence automatically applies the preformat style. |
Right: Headings use Capitalization for Nouns and Important Information and Words 4+ Letters
Wrong: Headings use capitalization for nouns and important Information and words 4+ letters
Writing Instructions
Instructions are numbered lists and links in the software are bold with arrows (dash plus > becomes: → ):
- Open Components → Edit and set your new component name
- Choose Lorem Ipsum and do something
XML snippets go into a code bracket with type XML: {code:xml} (this will insert a code macro here) like this:
...
<here is some></here is some>Screenshots
Screenshots use a Drop Shadow effect which can be accessed by Edit → Properties
Writing Best Practice
...
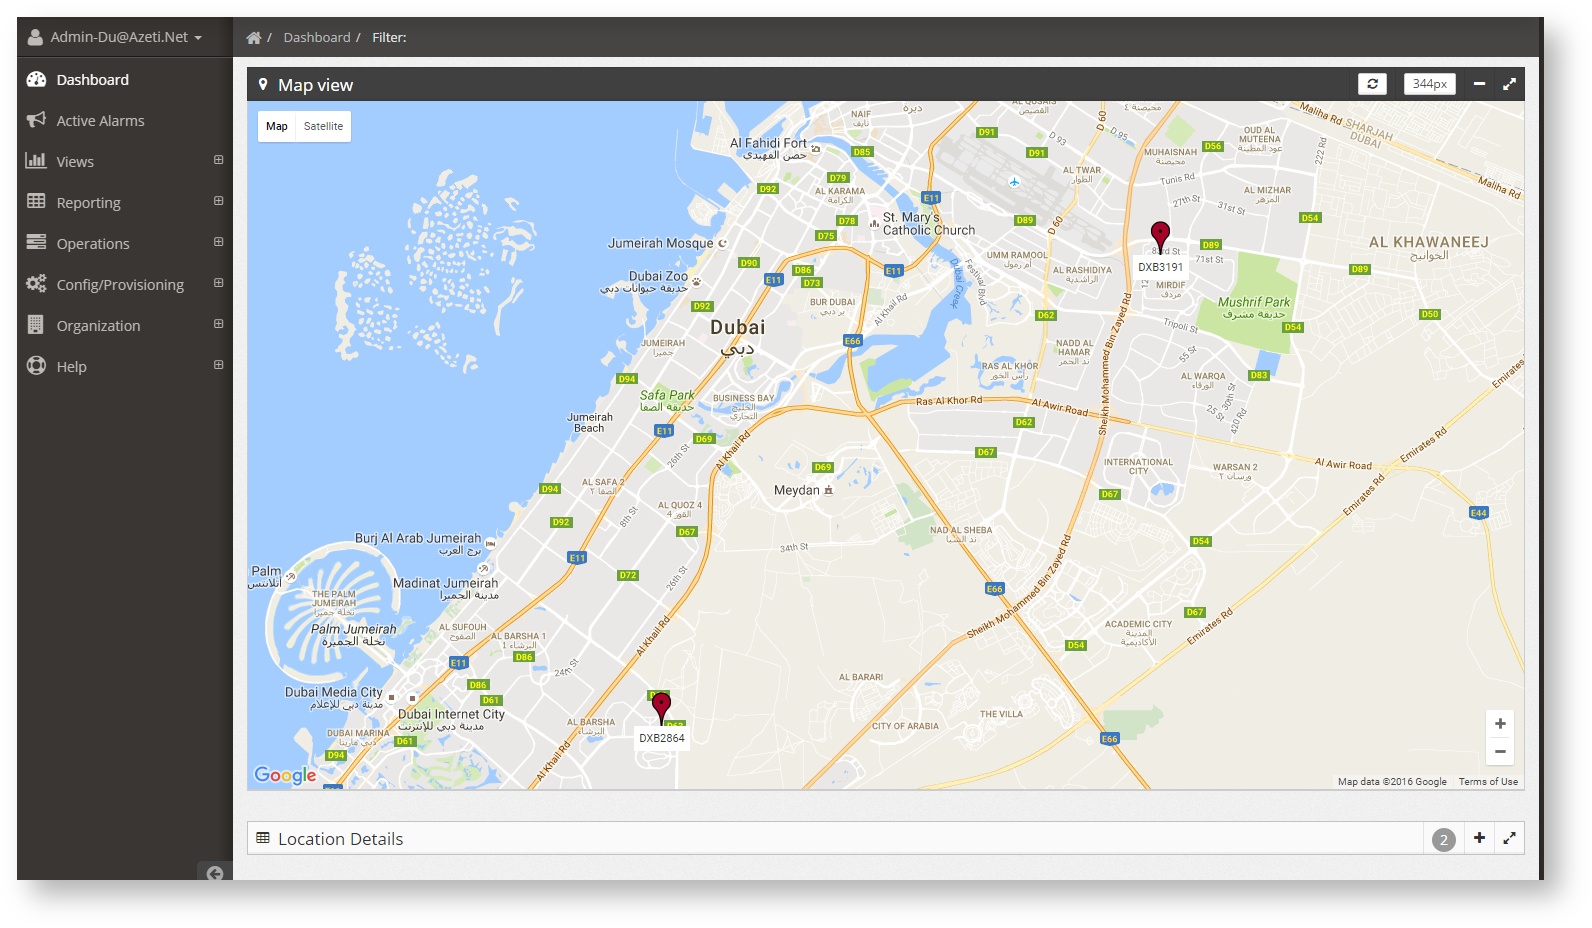
Map View
The map view shows all locations over a map, with direct link to all the locations functions.
When clicking on a site location, a menu is displayed with a direct link to the following features:
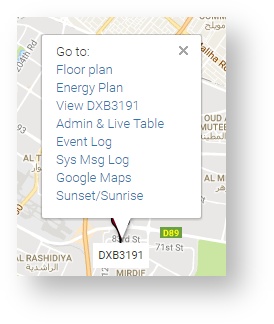
- Floor plan: If a floor plan has been uploaded it will show it here, with the sensor values superimposed
- Energy plan: Showing an energy flow diagram for the site (if it has been uploaded)
- View: It will lead directly to the first view associated with this sites (more on views on Views section)
- Admin & Live Table: a table that shows all location sensor, with the possibility to receive live data (see Admin & Live Table section)
Event log (see Reporting section)
Sys Msg Log (See Reporting section)
Locations List
To show it press the + sign at the bottom right of the screen. This list shows all the locations with:
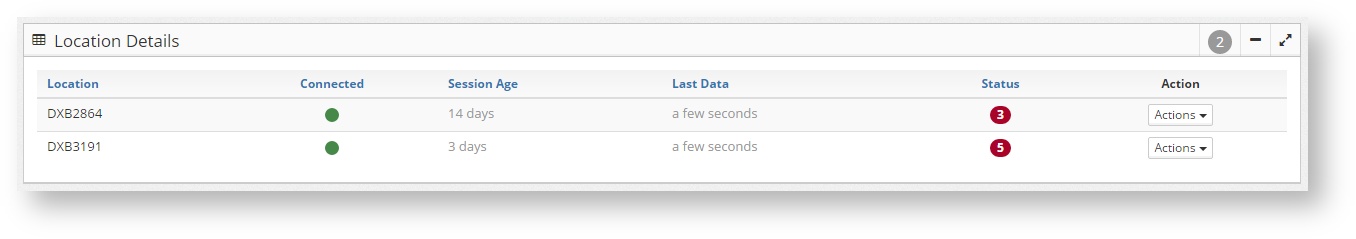
- The location name
- The connection status (connected or not connected)
- Session age: For how long it has been connected the last time
- Last Data: When it was the last time that received data
- Status: The status of the site. This is displayed by a colour: red means there are alarmed sensors, green no alarmed sensor, and the number inside is how many alarms sensors are in the site.
- An action button with several options related to the site:
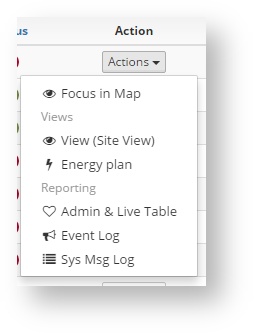
- Focus in Map: Focus the dashboard map on the the site location
- View: Goes to the default view of the site (see Views)
- Energy Plan: Shows the energy plan of the site (if loaded)
- Admin & Live table (see Admin & Live Table)
Event log (see Reporting section)
Sys Msg Log (See Reporting section)