Introduction
This document describes a basic overview of the operator functions in SONARMANAGER. This will help operators to have a basic overview of the system, as well as knowing several use cases that they can come during their shifts. This document can be used for training of operators.
Prerequisites:
- You have a SONARMANAGER installed.
- Your user access the SONARMANAGER with operator role.
- There is a project created in SONARMANAGER with at least one appliance connected to it.
On this page:
SONARMANAGER Overview
Locations, appliances, host and services
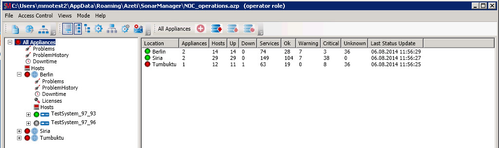
With Azeti SONARMANAGER you have an overview of all the SONARPLEX installed in your system in a tree-branch interface at the left of the screen. Typically, in your organization you will have several locations (i.e. Berlin, Viena, Turin), and some sub-locations for the different facilities. In each from this sub-locations, you will have one or more SONARPLEX appliances configured, that are the physical monitoring devices. For every SONARPLEX, you will see a list of hosts, that normally represent devices or computers, and for every host a list of services, that normally will be connected with a sensing interface (i.e. keypad, dry-contact, alarm, UPS, etc).
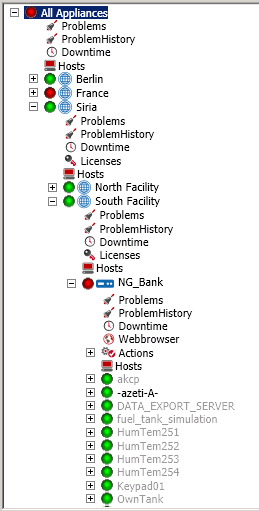 | In this image, you can see a list of locations (Berlin, France, Siria), and one of them has two sub-locations (Siria: North Facility and South Facility). In this sub-location, you find one appliance (NG_Bank), with some hosts. |
|---|---|
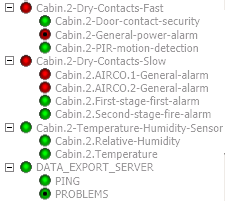 | In this image, you can see that a host can have one of multiple services, that will be checked by the SONARPLEX appliance. Some examples could be the Cabin.2.Temperature service, that is connected to a temperature sensor, or the Cabin.2-Door-contact-security, that is connected to a door contact. |
Reading host/services status
Host and services have always a round circle with a color next to them that indicates the status of this host/service. The following 4 status are possible:
 | The host/service is in status OK, meaning there is not a problem with the host or service. |
 | The host/service is in status WARNING, for signaling status that are not the standard situation, and depending on the service some action need to be taken. |
 | The host/service is in status CRITICAL, for signaling that something went wrong and probably an action need to be taken. |
 | The host/service is in status UNKNOWN, meaning that the information could not be retrieved. |
Services can also have the following statuses:
| (no special indication apart from the color) The service is an active check. Active checks can be performed at any time. |
 | The service is a passive check. Passive checks receive the information from an external device or daemon. Therefore, checks cannot be performed directly. |
 | The notifications for the service have been disabled. |
 | The system is in a scheduled Downtime. Notifications for its services will not be sent during the downtime period. |
Overview of an appliance
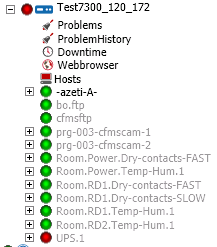
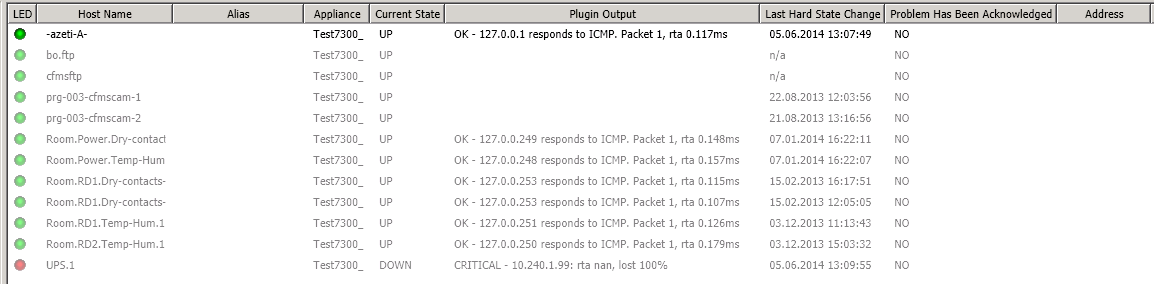
In order to have an overview of a SONARPLEX status, you can either open the branch of the appliance tree or click on that appliance to see a list of the host that belong to that appliance. The ones that are in green have all their services in an OK status. In case there is a service that has other status than OK, you will see that the icon next to the host name will be blinking. This is an indication that you should go an check what is going on on that host.
This system has a blinking light next to the host UPS.1. You should probably go and check its services.
| See the same overview when you click con the SONARPLEX name. Double click the troubled host to navigate to it in the tree directly.
|
|---|
This section and the following assumes that you are in the "host view" in SONARMANAGER unless other view is mentioned. 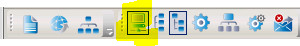
Problems and problems history
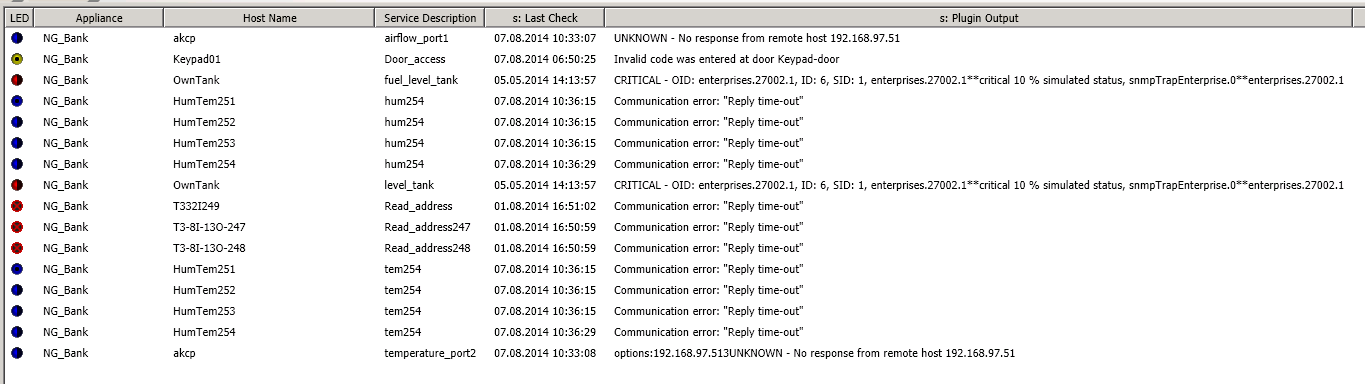
Whenever there is some service that is not in OK status, you will have a blinking light in the corresponding host indicating that something went wrong. In order to have a complete overview of the current problems in an appliance, you can go to the  link. This overview will let you see the status of host an services at a glance, including the name of the service, a timestamp and the output of the service. See following an example of an appliance with several issues.
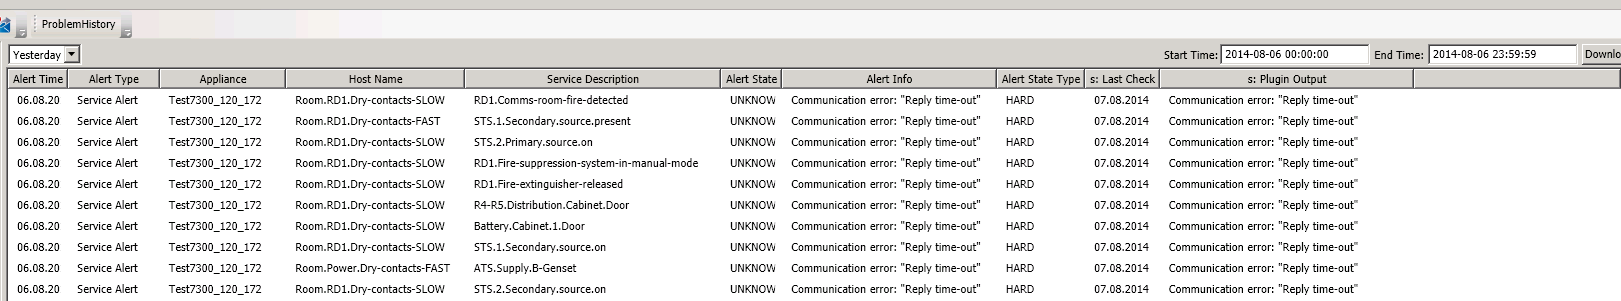
The Problem History branch in the tree is very similar to this overview, besides the fact that you can filter them by date. Simply select a time frame and press the button "Download" to have an overview of the problems in this system. This is very useful to get an idea of the services that are giving problem on a system, or for answering requests about some specific service in a concrete day.
Viewing service information
The service information //TO CONTINUE.
Acknowledging problems
When you identify a problem in a service, it has to be investigated and the cause addressed. Normally the status of the service
Writing comments
Actions
Sensor devices
Dry contacts (slow and fast)
Temperature and humidity sensors
Door operations
Use cases
Acknowledge a problem
Commenting in services
Opening and closing a door
Reading client/service comments and acknowledgments
Searching for problems on specific dates
Data exporter host