...
- The name of the dashboard
- The reference site that will be used for configuration (select it from the drop down)
- The default time range for the dashboard. The number and unit will determine the time range of the graphs and events displayed by default. For example, setting it to 3 days means that the information shown will the be one of the last 3 days. If left empty it will take as default 1 day.
- Refresh interval: How often the data shown will be refreshed. Please note this only applies to the graph widgets, as all other widgets always show the last value and are updated live.
- Tags: The tags associated with this dashboard. It can only be filled after the dashboard is created for the first time.
- Show Related: When shown a dashboard, all related dashboards (for sharing the same tag, or the some of the tags the site has assigned) are shown in top of the pages. This can be shown in two different ways:
- Tabs
-

- Dropdown Menu, which groups all the dashboards with the same tag under a single menu
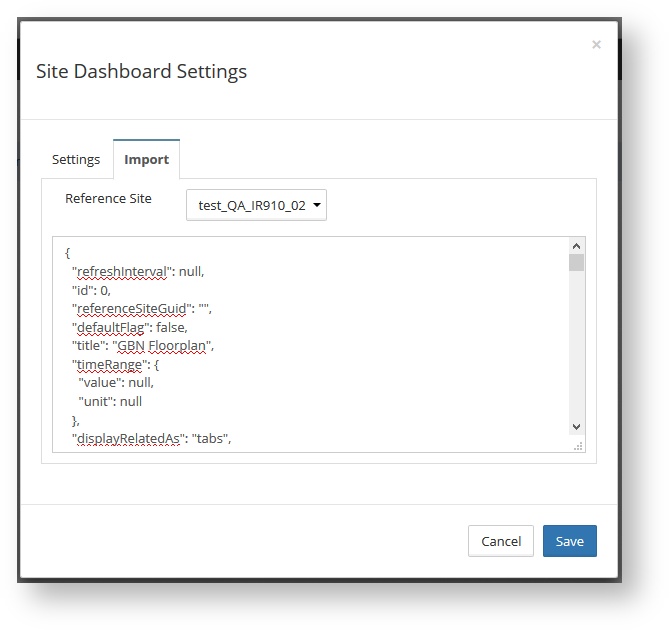
Exporting and Importing Dashboards
Dashboards can be exported and imported into a different server, organization, etc.
To export a dashboard, go to the Dashboard, click Settings and Export as Json. This will download a text file in json format with the dasboard information. To import it, go to Dashboard, click "+New Dasboard" and go to the Import tab. Select a site as reference site and paste the content of the exported file into the text box (use a text editor to open the file and copy the text). The click save.
Widgets
On the views the data is shown in widgets.
...