Dashboards
Dashboards are the customizable panels used to show graphs or sensor information in one page.
The dashboards are created and edited by the admin users, and there are two kind:
- Public: Accessible to all users of the organization, whether they are Admins or Operator
- Private: Only accessible to the user that created it
Accessing the dashboards
There are different ways to access the dashboards:
- Through the location tree
- Through the dashboard map
- Through the left menu: go to Dashboards and select the dashboard. It will be loaded with its reference site. Change it using the location box if needed.
Creating a Dashboard
To create view click on +New Dasboard on Dashboards
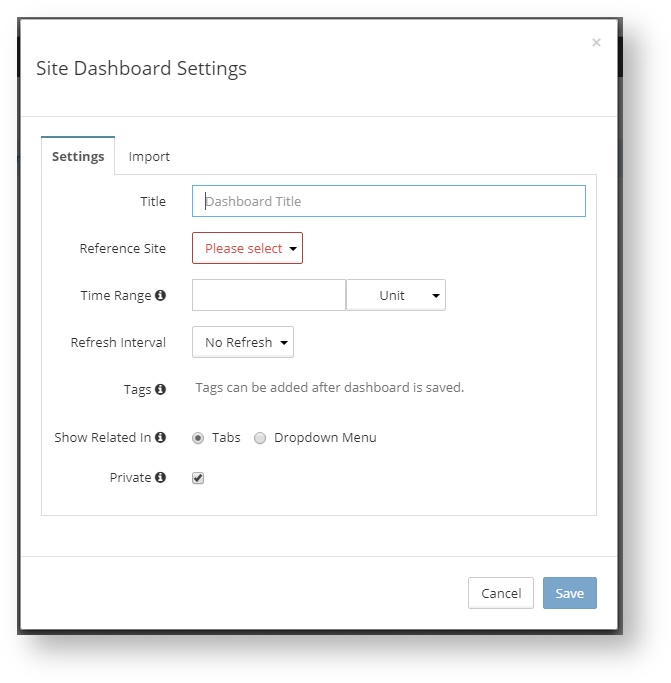
Once done that fill:
- The name of the dashboard
- The reference site that will be used for configuration (select it from the drop down)
- The default time range for the dashboard. The number and unit will determine the time range of the graphs and events displayed by default. For example, setting it to 3 days means that the information shown will the be one of the last 3 days. If left empty it will take as default 1 day.
- Refresh interval: How often the data shown will be refreshed. Please note this only applies to the graph widgets, as all other widgets always show the last value and are updated live.
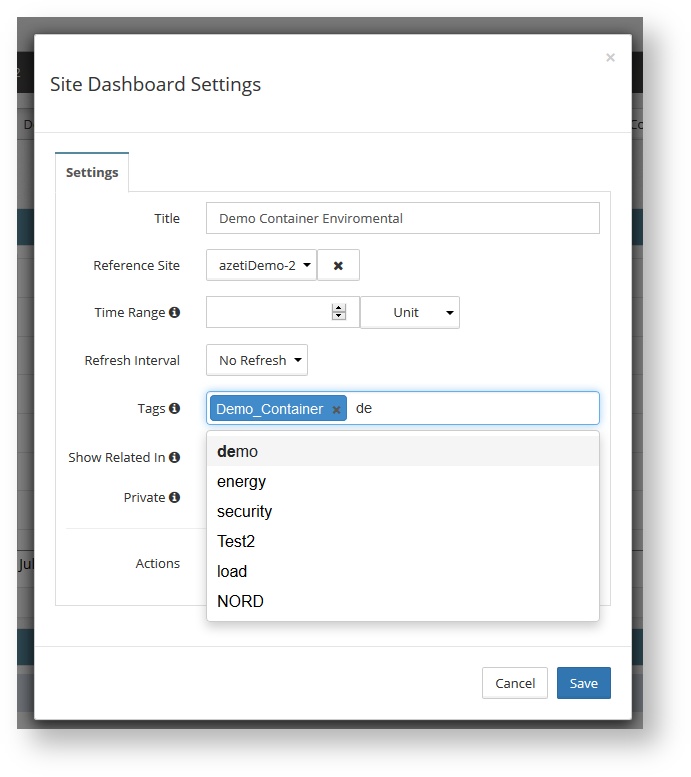
- Tags: The tags associated with this dashboard. It can only be filled after the dashboard is created for the first time.
- Show Related: When shown a dashboard, all related dashboards (for sharing the same tag, or the some of the tags the site has assigned) are shown in top of the pages. This can be shown in two different ways:
- Tabs
-

- Dropdown Menu, which groups all the dashboards with the same tag under a single menu
Exporting and Importing Dashboards
Dashboards can be exported and imported into a different server, organization, etc.
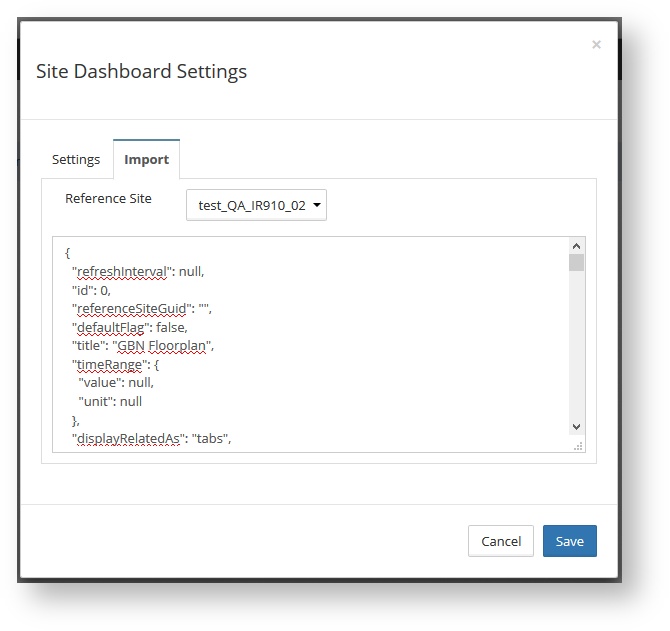
To export a dashboard, go to the Dashboard, click Settings and Export as Json. This will download a text file in json format with the dasboard information. To import it, go to Dashboard, click "+New Dasboard" and go to the Import tab. Select a site as reference site and paste the content of the exported file into the text box (use a text editor to open the file and copy the text). The click save.
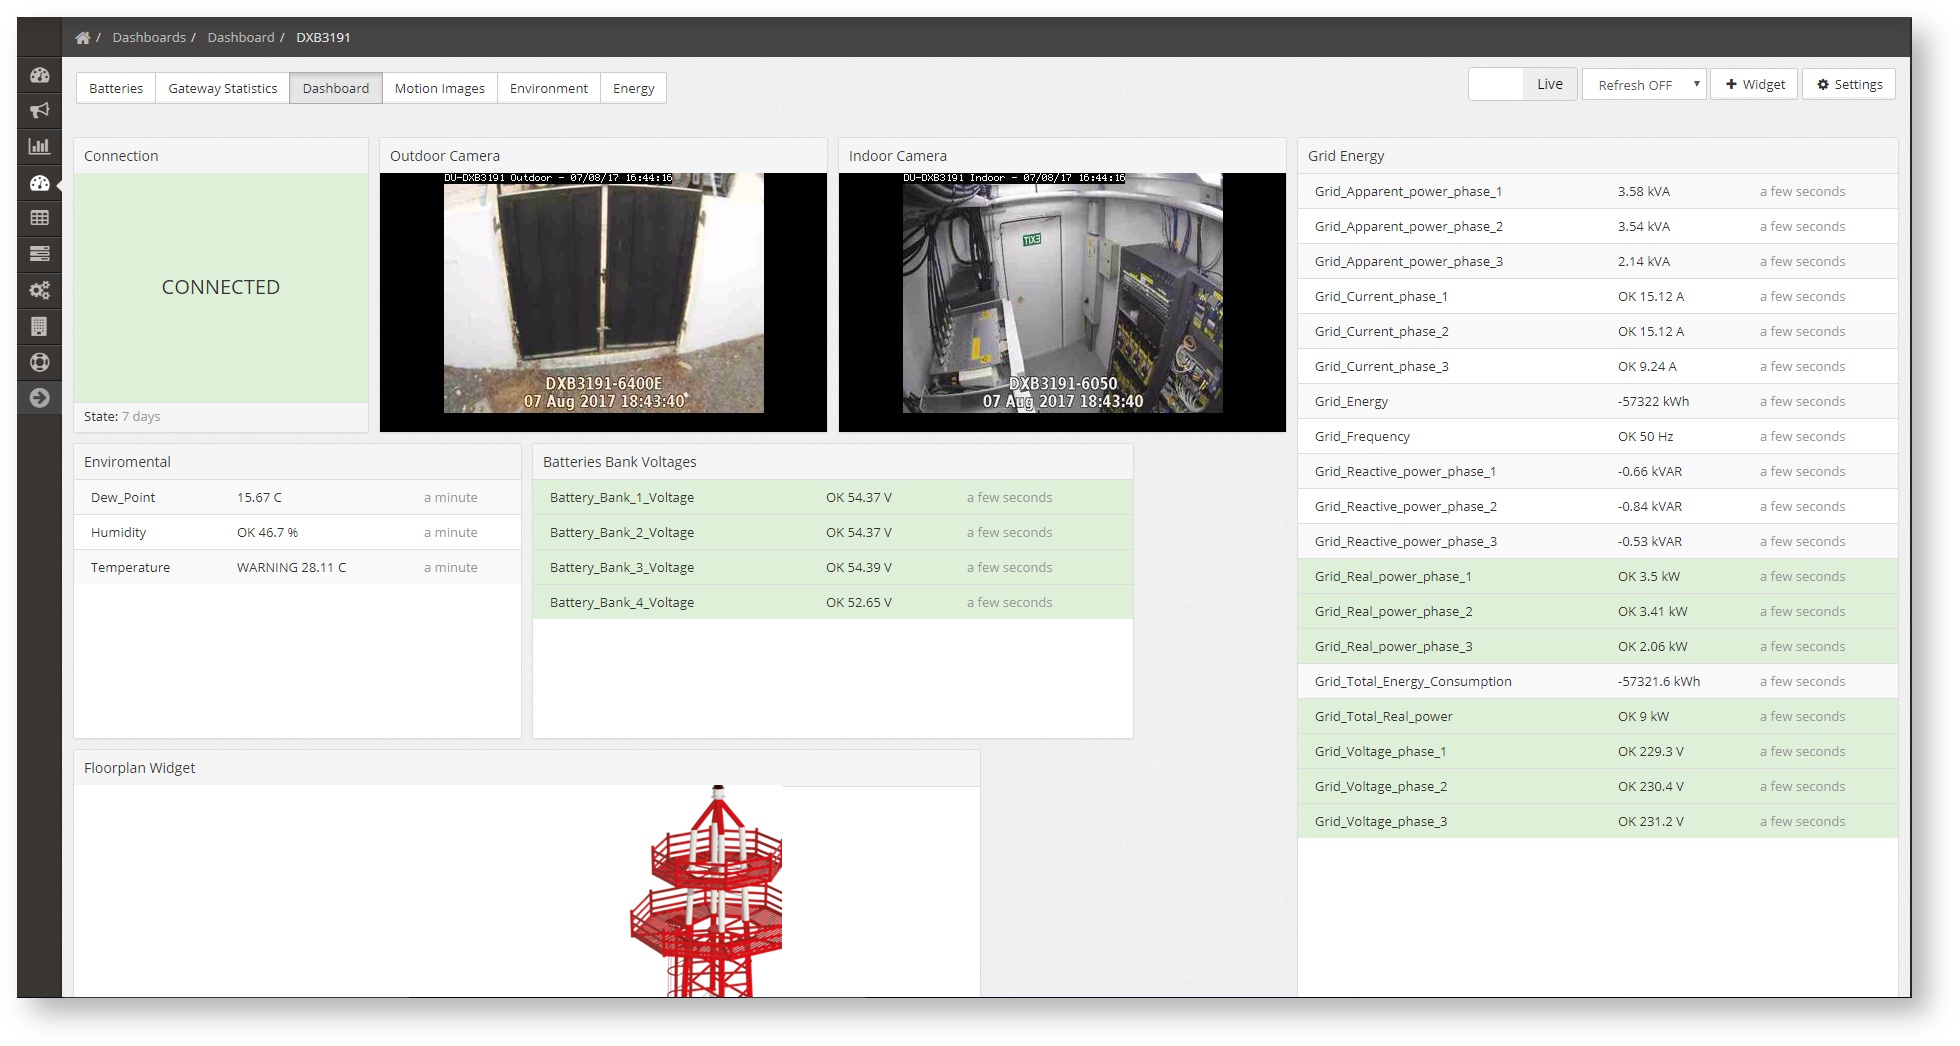
Widgets
On the views the data is shown in widgets.
Moving and Resizing the Widgets
Widgets can be moved freely around the dashboard by clicking on the top bar of the widget, dragging and dropping. They can also be resized by moving the borders of the widget. When being resized, the grey shadow beneath will indicate to which size they will change once the user releases the mouse button.
Widget Types
The widgets can be off the following types
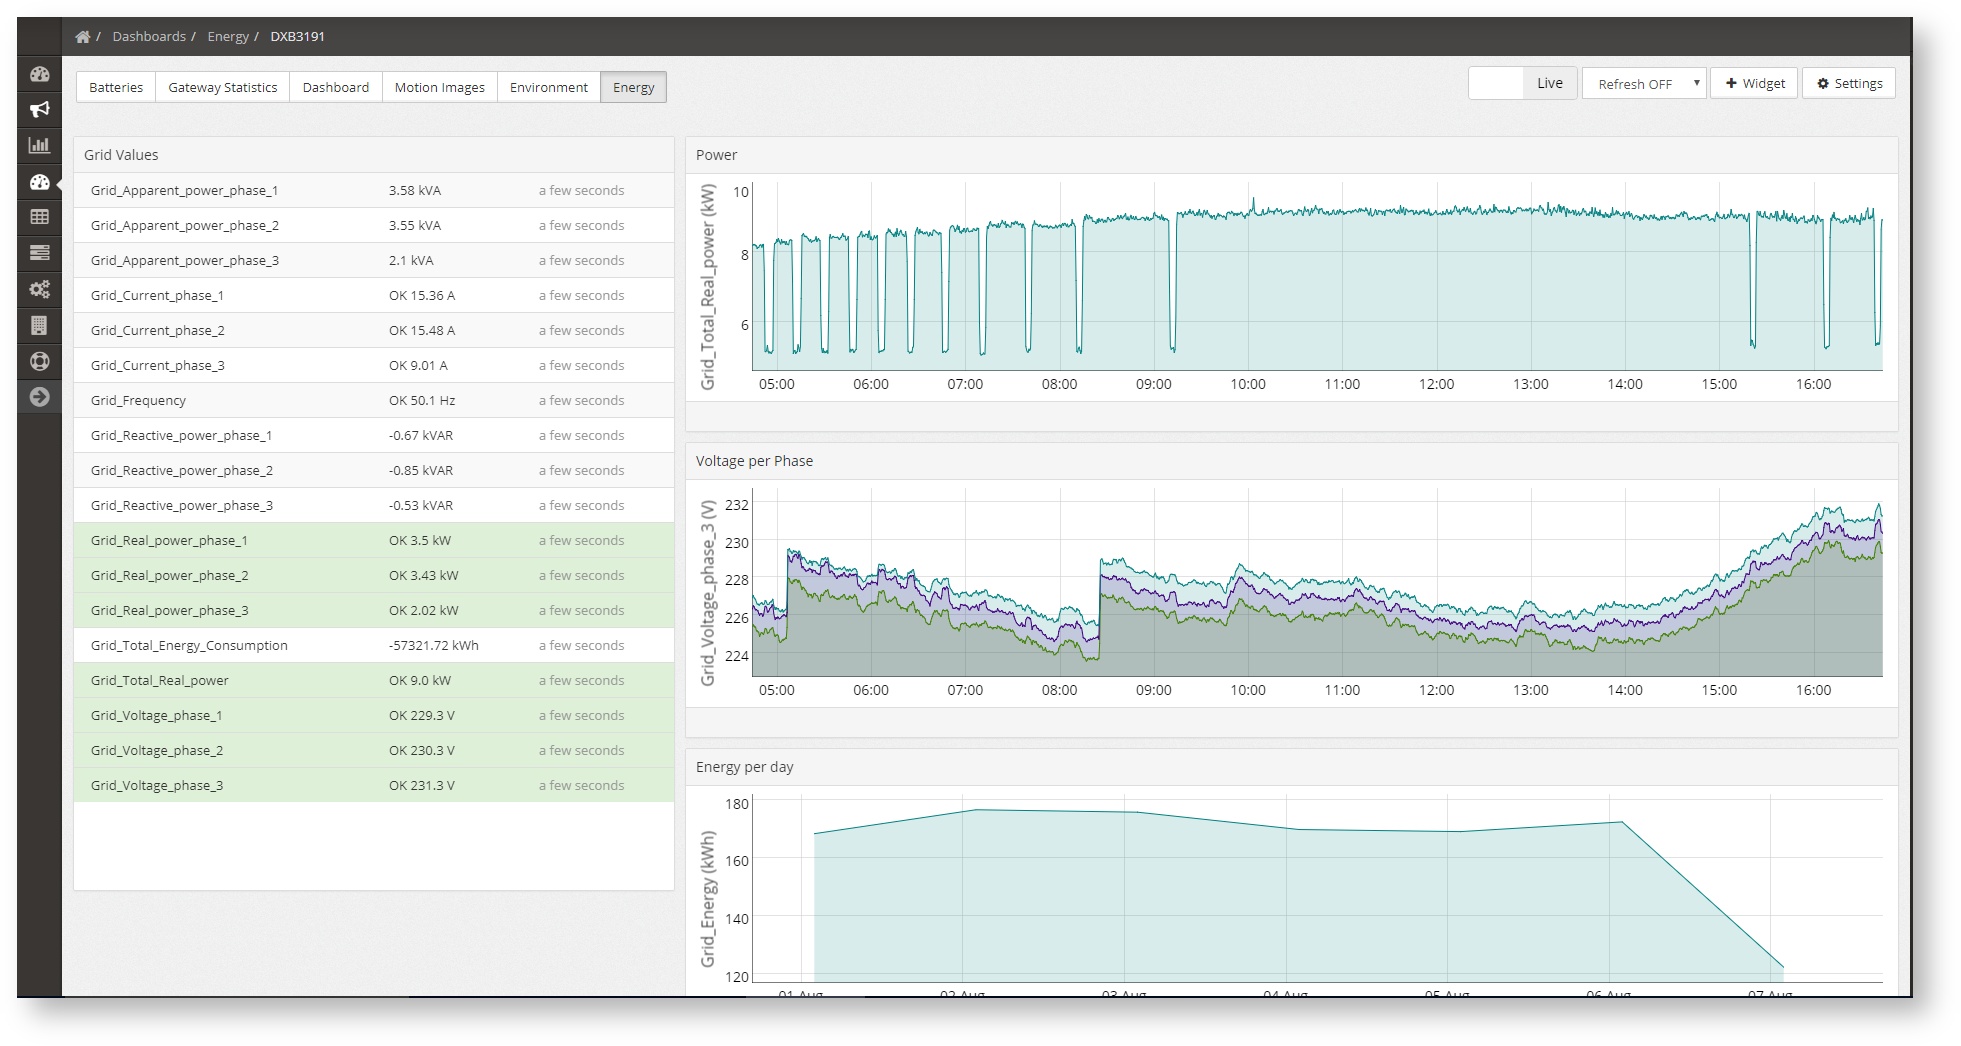
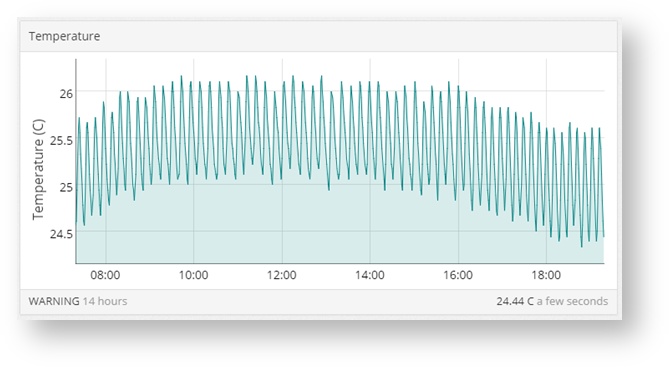
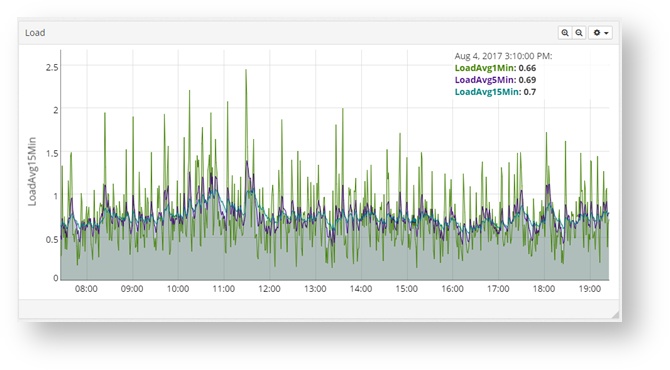
Line widget
Shows only the values of one or several sensors in a plot
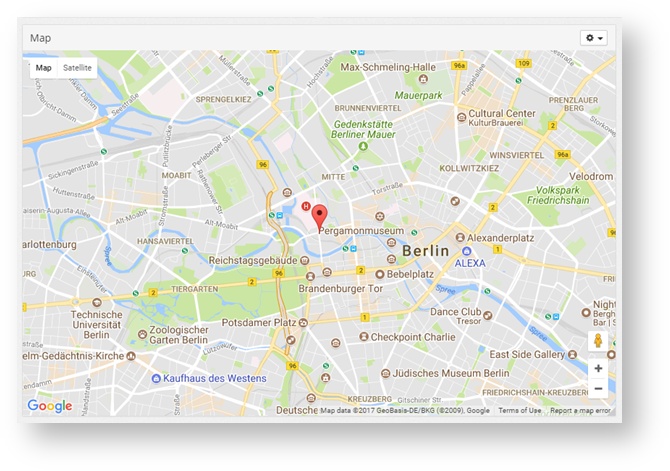
Map
Widget that shows the position of the site on a map:
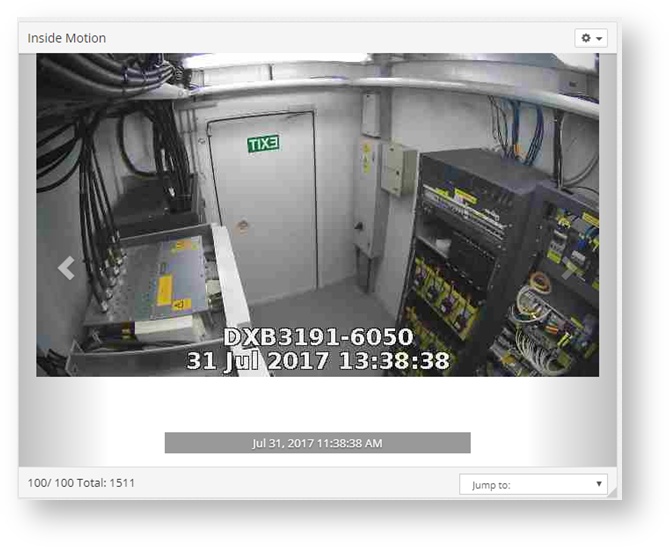
Images
This widget is able to display images taken by the SiteController. Includes the possibility to scroll through the last ones or select them from a menu.
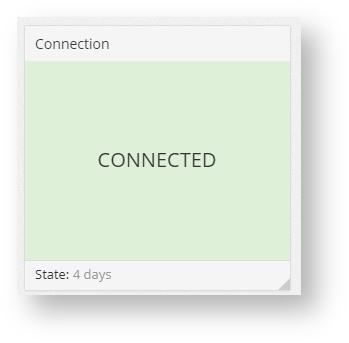
Current State
Shows the current state of any configured sensor:
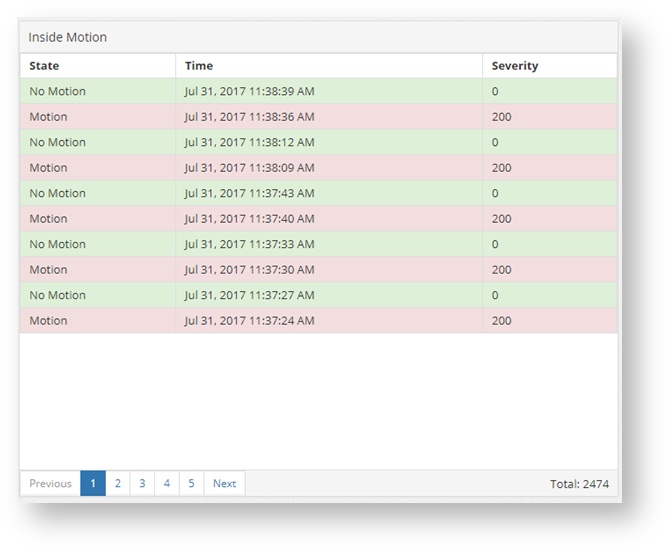
Events
Shows a list of events for the configured sensors, along with the severity (if any):
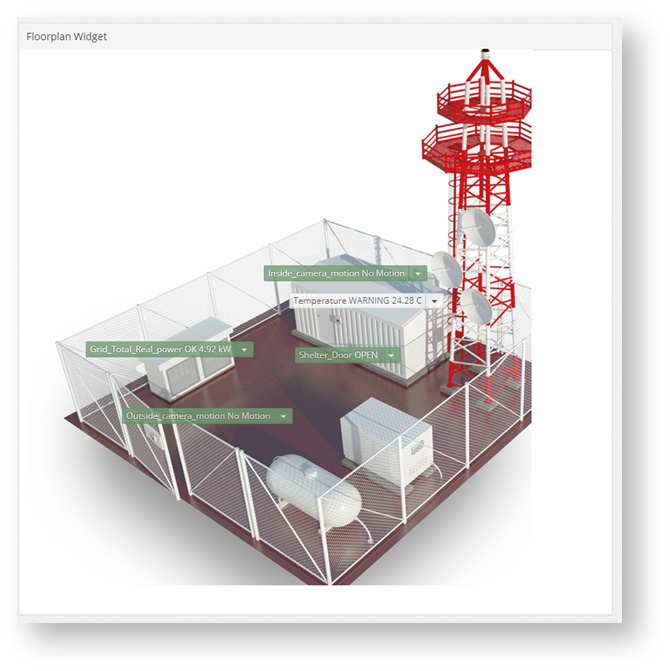
Floor Plan
This widget can show the sensors values and/or states superimposed over a floor plan. Any picture or image can be uploaded as the floorplan:
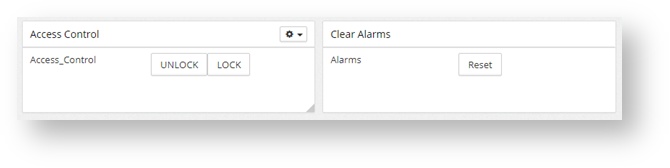
Actions
Shows a button for the corresponding configured action or actions.
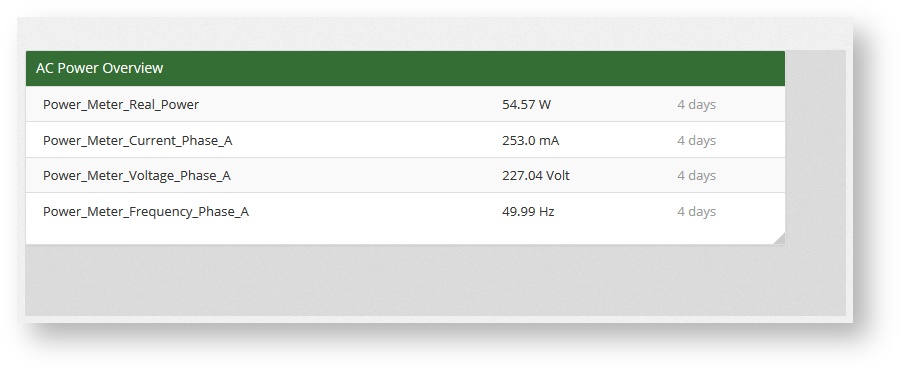
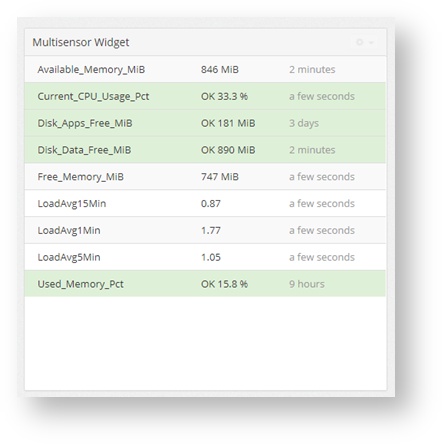
Multisensor table
Shows the state and/or value of several sensors under the same widget.
In the config of the widget it is necessary:
- The width of the widget
- The Title
- The sensor (or sensors) from which the data will be taken
- The criteria to limit the size of the data
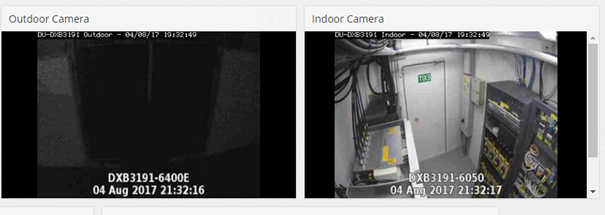
Live Video Widget
This video shows live video from https sources.
NOTE: If the azeti server is configured to use https, then only sources streaming in https can be used. If http is used in the server, http sources can also be used. Basic Auth devices only work with Firefox. Accepted codecs: mjpeg, mp4, ogg.
Widget Configuration
Once the Widget is added, it can be configured by pressing the Edit button on the top right corner.
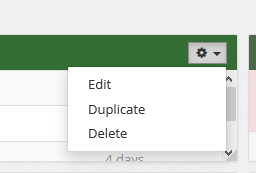
After pressing that button, configure the widget and hit save.
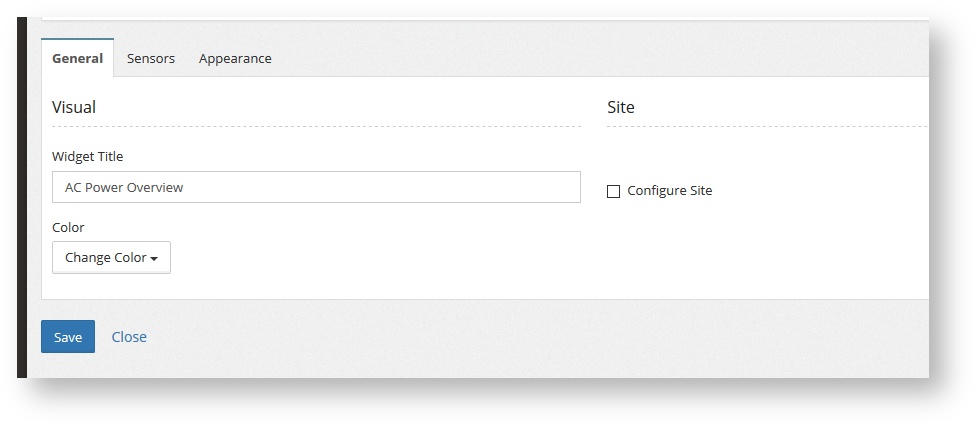
General Configuration
All kinds of widget have the General configuration tab. In this it can be configured:
- The Widget Title
- The color of the top bar
- The site that will be used as a reference for the widget. By default it uses the one defined for the dashboard, but this can be overridden by selecting that option.
Dashboard Tags
Once created, a dashboard can have one or many tags assigned. Tags are used to group dashboards together, and to assign them to sites.
To add a tag to a dashboard go to Setting on the dashboard. Once there type the name of the tag. If it already exists it will be assigned. If not it will first be created and assigned. A site can have as many tags as the user wants.