Grafana Integration
Introduction
Grafana is an awesome graphing tool and we love it. It provides highly advanced graphing features and we are happy to provide an integration from our Engine into Grafana.
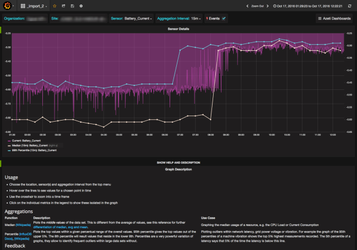
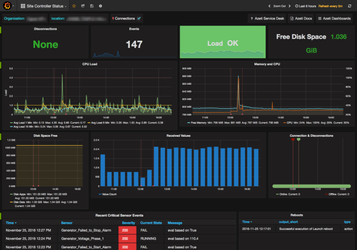
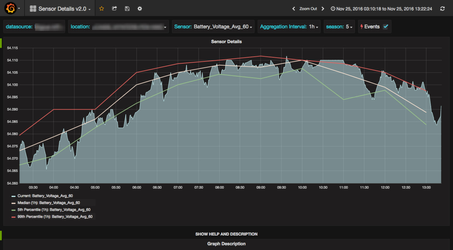
Azeti Dashboards in Grafana |
||
|---|---|---|
|
|
|
|
|
|
|
How it works
The azeti Engine uses InfluxDB for storing time series data (e.g. sensor measurements) and Grafana ships with built in support for it. Our Grafana API endpoint abstracts the access to the influx db with added data from our Engine. You can use the default Influx Driver in Grafana and access data from your Engine installation.
The authentication between Engine and Grafana is established through a Engine User with API Access.
Features
- Create awesome Graphs to plot sensor data in detail
- Apply functions on the data, e.g.
median(), min()orpercentile(), check out the documentation - Combine sensor graphs with the event stream to plot sensor events in the graph
- Create dashboards showing off the performance of your installation, sensor details and metrics
- Use our pre-built dashboards to get started quickly, download here
Engine Setup
The azeti Engine Versions 1.1 and higher come with Grafana support by default.
- Login as Super Admin in the Control Panel
Open System Parameters and configure a string password for
azeti.influxdata.grafana.passwordThe user and password are used for the internal authentication of the Engine instance to the underlying database.
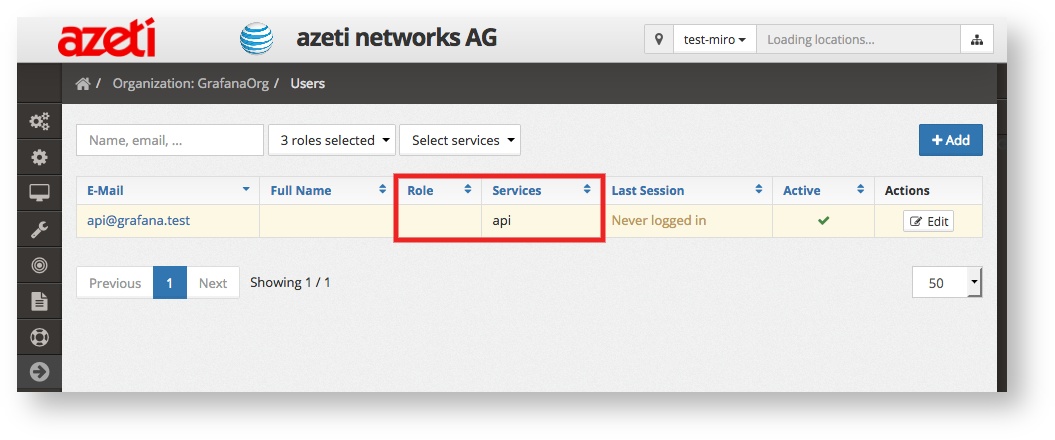
Create a new User with Access to API, check out this KB article for instructions
Create a user that has no role and only API access privileges for maximum security, it is not recommended to reuse existing users for the integration.
Grafana Setup
This part of the configuration is straight forward too, create a data source and import dashboards.
Create the Data Source
Each Engine organization will be represented as a unique data source in Grafana, this is due to the strict separation of data between individual organizations. Each Org will require an API user too.
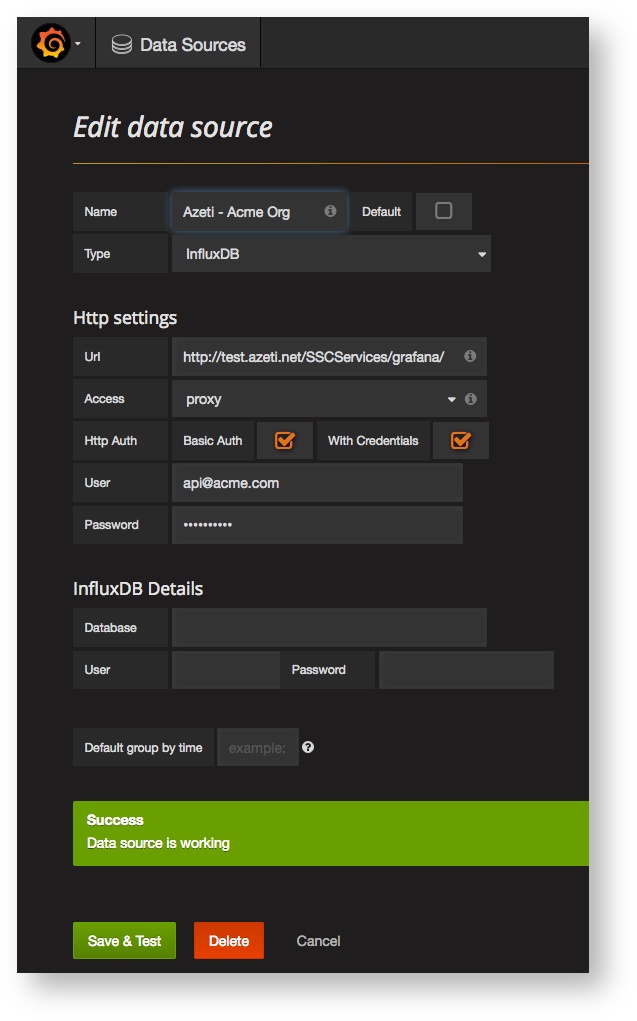
- Create a new data source of type InfluxDB
- Set the parameters:
- URL according to your Engine's Address, e.g. https://test.azeti.net/SSCServices/grafana/
- Basic Auth:yes
- With Credentials:yes,
- Username and Password of the newly created API User
Click Save & Test and a Success Message should be shown.
Import the azeti Dashboards
We created a couple of dashboards to get you jump started.
- Download the dashboards from our public Bitbucket repository
- Open the Dashboards menu in Grafana and Import the dashboards as described here