check_monitor_stats - Service Check for Performance Metrics of the Monitor Process
| Extension Version: | 1.0.0 |
|---|---|
| Supported SONARPLEX Version(s): | 5.1.1a or higher |
| Requires: | --- |
This plugin allows you to monitor detailed performance metrics of the Monitor Process. It is especially useful to do performance analysis of your monitoring configuration and for troubleshooting. Understanding the metrics requires some deep understanding of the internal processing and thus is considered an advanced topic.
Installation
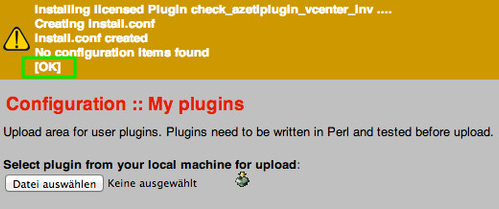
- Open the Administration Web Interface> Configuration > My Plugins
- Choose Browse and select the new extension file and click
 to start the upload
 - The installation was successful if no errors are shown in red and the last status line is OK
See the Managing Extensions with the Administration Web Interface article for further information.
Configuration
The check uses SONARPLEX internal metrics so it should be bound to an internal host. You can do so by creating a new host that points to localhost, name it -azeti-Benchmark and set Host Address to 127.0.0.1.
On this page:
Variables
The check queries for external variables that hold the performance metrics. These are explained below in detail.
| Setting | Description |
|---|---|
| PROGRUNTIMETT | string with time Nagios process has been running (minutes) |
| STATUSFILEAGETT | string with age of status data file (minutes). |
| TOTCMDBUF | total number of external command buffer slots available. |
| USEDCMDBUF | number of external command buffer slots currently in use. |
| HIGHCMDBUF | highest number of external command buffer slots ever in use. |
| NUMSERVICES | total number of services. |
| NUMHOSTS | total number of hosts. |
| NUMSVCOK | number of services OK. |
| NUMSVCWARN | number of services WARNING. |
| NUMSVCUNKN | number of services UNKNOWN. |
| NUMSVCCRIT | number of services CRITICAL. |
| NUMSVCPROB | number of service problems (WARNING, UNKNOWN or CRITIAL). |
| NUMSVCCHECKED | number of services that have been checked since start. |
| NUMSVCSCHEDULED | number of services that are currently scheduled to be checked. |
| NUMSVCFLAPPING | number of services that are currently flapping. |
| NUMSVCDOWNTIME | number of services that are currently in downtime. |
| NUMHSTUP | number of hosts UP. |
| NUMHSTDOWN | number of hosts DOWN. |
| NUMHSTUNR | number of hosts UNREACHABLE. |
| NUMHSTPROB | number of host problems (DOWN or UNREACHABLE). |
| NUMHSTCHECKED | number of hosts that have been checked since start. |
| NUMHSTSCHEDULED | number of hosts that are currently scheduled to be checked. |
| NUMHSTFLAPPING | number of hosts that are currently flapping. |
| NUMHSTDOWNTIME | number of hosts that are currently in downtime. |
| NUMHSTACTCHK[1/5/15/60]M | number of hosts actively checked in last 1/5/15/60 minutes. |
| NUMHSTPSVCHK[1/5/15/60]M | number of hosts passively checked in last 1/5/15/60 minutes. |
| NUMSVCACTCHK[1/5/15/60]M | number of services actively checked in last 1/5/15/60 minutes. |
| NUMSVCPSVCHK[1/5/15/60]M | number of services passively checked in last 1/5/15/60 minutes. |
| [AVG/MIN/MAX]ACTSVCLAT | MIN/MAX/AVG active service check latency (ms). |
| [AVG/MIN/MAX]ACTSVCEXT | MIN/MAX/AVG active service check execution time (ms). |
| [AVG/MIN/MAX]ACTSVCPSC | MIN/MAX/AVG active service check %% state change. |
| [AVG/MIN/MAX]PSVSVCLAT | MIN/MAX/AVG passive service check latency (ms). |
| [AVG/MIN/MAX]PSVSVCPSC | MIN/MAX/AVG passive service check %% state change. |
| [AVG/MIN/MAX]SVCPSC | MIN/MAX/AVG service check %% state change. |
| [AVG/MIN/MAX]ACTHSTLAT | MIN/MAX/AVG active host check latency (ms). |
| [AVG/MIN/MAX]ACTHSTEXT | MIN/MAX/AVG active host check execution time (ms). |
| [AVG/MIN/MAX]ACTHSTPSC | MIN/MAX/AVG active host check %% state change. |
| [AVG/MIN/MAX]PSVHSTLAT | MIN/MAX/AVG passive host check latency (ms). |
| [AVG/MIN/MAX]PSVHSTPSC | MIN/MAX/AVG passive host check %% state change. |
| [AVG/MIN/MAX]HSTPSC | MIN/MAX/AVG host check %% state change. |
| NUMACTHSTCHECKS[1/5/15]M | number of total active host checks occuring in last 1/5/15 minutes. |
| NUMOACTHSTCHECKS[1/5/15]M | number of on-demand active host checks occuring in last 1/5/15 minutes. |
| NUMCACHEDHSTCHECKS[1/5/15]M | number of cached host checks occuring in last 1/5/15 minutes. |
| NUMSACTHSTCHECKS[1/5/15]M | number of scheduled active host checks occuring in last 1/5/15 minutes. |
| NUMPARHSTCHECKS[1/5/15]M | number of parallel host checks occuring in last 1/5/15 minutes. |
| NUMSERHSTCHECKS[1/5/15]M | number of serial host checks occuring in last 1/5/15 minutes. |
| NUMPSVHSTCHECKS[1/5/15]M | number of passive host checks occuring in last 1/5/15 minutes. |
| NUMACTSVCCHECKS[1/5/15]M | number of total active service checks occuring in last 1/5/15 minutes. |
| NUMOACTSVCCHECKS[1/5/15]M | number of on-demand active service checks occuring in last 1/5/15 minutes. |
| NUMCACHEDSVCCHECKS[1/5/15]M | number of cached service checks occuring in last 1/5/15 minutes. |
| NUMSACTSVCCHECKS[1/5/15]M | number of scheduled active service checks occuring in last 1/5/15 minutes. |
| NUMPSVSVCCHECKS[1/5/15]M | number of passive service checks occuring in last 1/5/15 minutes. |
| NUMEXTCMDS[1/5/15]M | number of external commands processed in last 1/5/15 minutes. |
Settings
| Setting | Description |
|---|---|
| Variable Measured | Choose the Variable which should be checked |
| Warning Threshold | Numeric threshold for the WARNING state |
| Critical Threshold | Numeric threshold for the WARNING state |
SONARMANAGER Host Template
Use the Host Template (extension .atf) included in the plugin distribution ZIP Archive as a start for configuration.
Importing host template(s):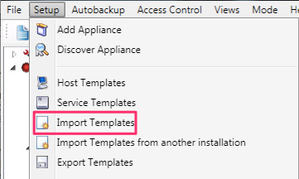
- style