Performance Graph Settings
The following describes the settings for Configuration > System > Performance Graph Settings in detail. These settings affect.
- Appearance of the performance graphs in the User Web Interface, like size, color and type of plot
- Creation of RRD files and lifetime of the stored values
- Contents of graph like plotting a MAX or LAST value
Performance Data Collection - RRD
Performance data is collected and stored in Round Robin Database files, so called RRDs. The files have a fixed size and thus a fixed number of data slots. Older data is then averaged over time to provide this fixed container size. This does not mean that measurements are lost, it rather means that measurement of the farer past are saved in a lower resolution as measurements from the last week.
Therefore data is saved in two containers (RRAs, Round Robin Archives):
- high resolution RRA
- low resolution RRA
Each container holds data of a fixed amount of time but with different resolutions.
On this page:
Export
Performance data can be exported with the Data-Exporter Addon.
Graph Types
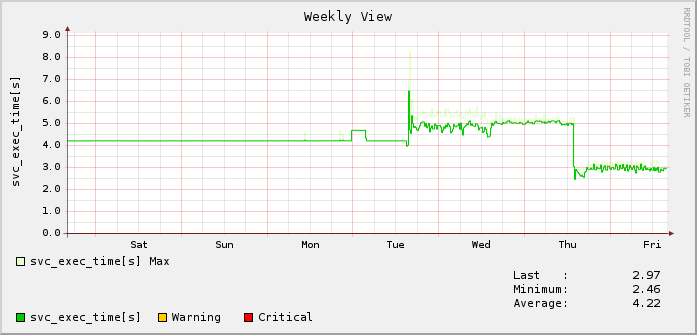
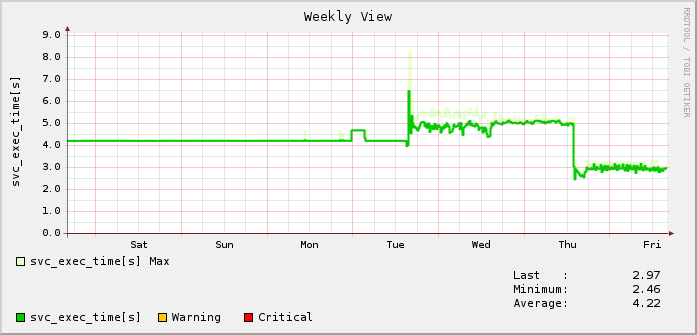
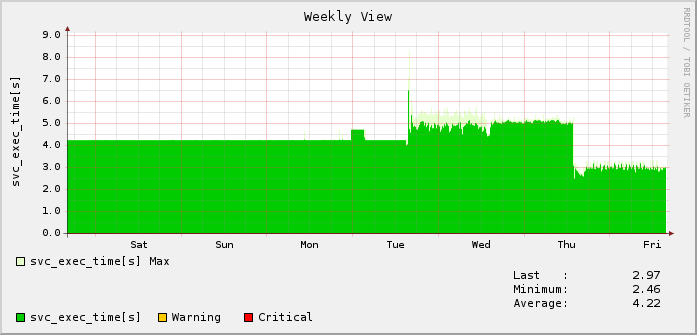
Three different graph types are available. The LINE types should be used for measurements with drops and peaks where area is the better choice measures such as disk usages.
You can configure the type either globally here or you can override the global value on a service base with the service setting Performance data type
Thin Line - LINE1
Thick Line - LINE2
Filled Area - AREA
Settings
The following table explains all settings in detail.
Setting | Description |
|---|---|
| Graph type: | Global graph type which is used if nothing different was specified. |
| High resolution data interval (minutes): | The lowest interval for stored data that is used for the AVERAGE during plotting. This should be as low as the lowest Normal Check Interval of any configured service to provide high accuracy. If this resolution interval is chosen larger than the Normal Service Check Interval the values will be averaged. |
| High resolution data pool size (days): | Time in days specifying how long values are stored in the low resolution data archive RRA (Round Robin Archive). |
| Low resolution data interval (minutes): | The lowest interval in minutes for the low resolution container. Specifies over how many minutes the collected data should be averaged and stored. |
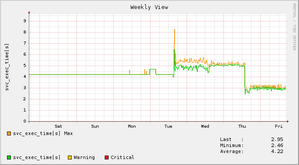
| Resolution for MAX values (items): | The MAX resolution decides about how many values are taken to evaluate the maximum. The default is 3 so the maximum value out of 3 measured values is plotted (if it is enabled by [Plot MAX value]). |
| Low resolution data pool size (years): | Specified the number of years for storage of low resolution data. |
| Graph width (px): | Width of graphs in pixels Raise the width to get wider graphs and to subjectively enlarge the detail.
|
| Graph height (px): | Height of graphs in pixels |
| Color for MAX of first value: | Color for plotting the MAX values, use a bright color to visualize peaks.
|
| Color for MAX of second value: | Color for the MAX value of the possible second measurement |
| Color for first value: | Color for the first value |
| Color for second value: | Color for the second value Plotting of two values is currently only supported for check_icmp based services. |
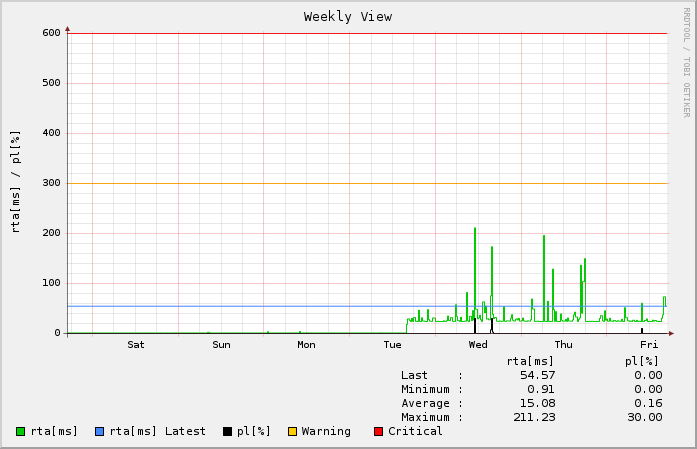
| Color for LAST value: | Color for the horizontal line plotted for the LAST value of every graph.
|
| Color for WARNING: | Color for horizontal WARNING threshold line |
| Color for CRITICAL: | Color for horizontal CRITICAL threshold line |
| Plot MAX value: | Enables or disables the plotting for the MAX value. Plotting the MAX value can sometimes lead to confusion, especially when plotting time critical measurements such as ICMP round trip times whee such MAX could be misread as jitter. |
| Plot LAST value: | Enables or disables the plotting of the LAST value, helps you compare the last measurement against the average of the past |
| Debug Level: | Debug Level, should only be changed when necessary for troubleshooting |
| Warning threshold for RRD disk usage (Gb): | Threshold when the built-in service check RRD-Disk-Usage on the host -azeti-A- should turn into WARNING |
| Critical threshold for RRD disk usage (Gb): | Threshold when the built-in service check RRD-Disk-Usage on the host -azeti-A- should turn into CRITICAL |
- style