Reporting
Introduction
The reports section is where all the historic information and logs can be found. Several reports are defined, depending on the type of information shown on them.
Sensors
Events
Shows all the historic list of sensor events (or alarms) for a specific site. In the top right corner to total number of events can be seen.
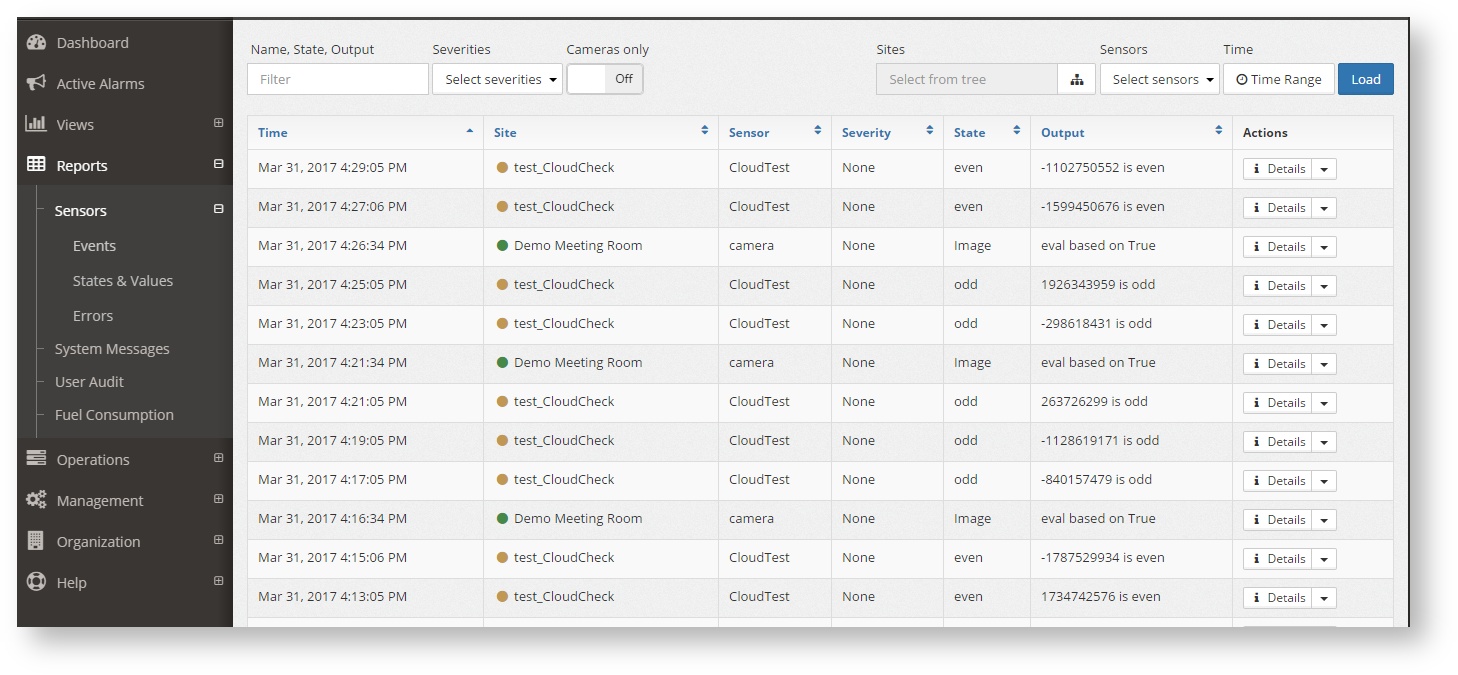
The event list can be filtered by:
- Name, State, Output: This filter will apply to the Name, State and Output values, showing only the ones that match.
- Severities: Show only events of the selected severity
- Cameras only: Shows only the sensor that have an image associtated. Hovering over the camera icon (
 ) shows the picture.
 - Sites: pressing the button will show the location tree that allows to filter the alarms by location or region (as defined on the location tree)
- Sensors: Sensor name. Select from the drop down or use the autofill text box.
- Time Range: To select the time period for which the events will be shown.
To reload the whole report using the same select filter press the button "Load"
States & Values
Shows the last status of a specific sensor across all sites
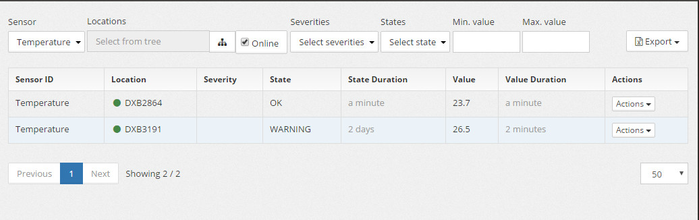
A sensor has to be selected before the report shows any value. After that filtering can be done by Online state, the state of the sensor, the minimum value and the maximum values. The location tree can also be used to filter per site or region. The resulting list can be exported to CSV.
Errors
Show all the sensor in the network that are in ERROR state. That is usually because the sensor is nos answering or is configured incorrectly. This reports helps finding the sensors with problems so remedy actions can be taken
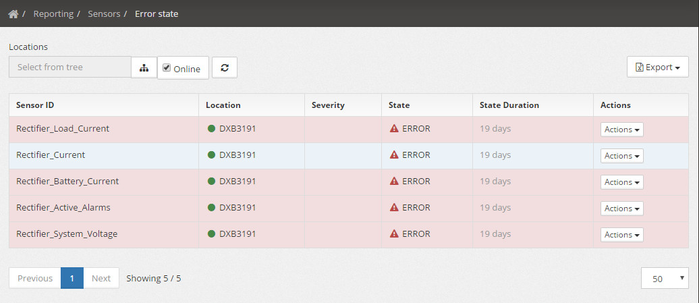
This report is equivalent to the last status report, but filtered for the sensors that are in ERROR state. The location tree can also be used to filter per site or region. The resulting list can be exported to CSV.
System Messages
Shows the system messages for a specific site. Once in the report a site has to be selected, unless the location menu has been used to get to the report.
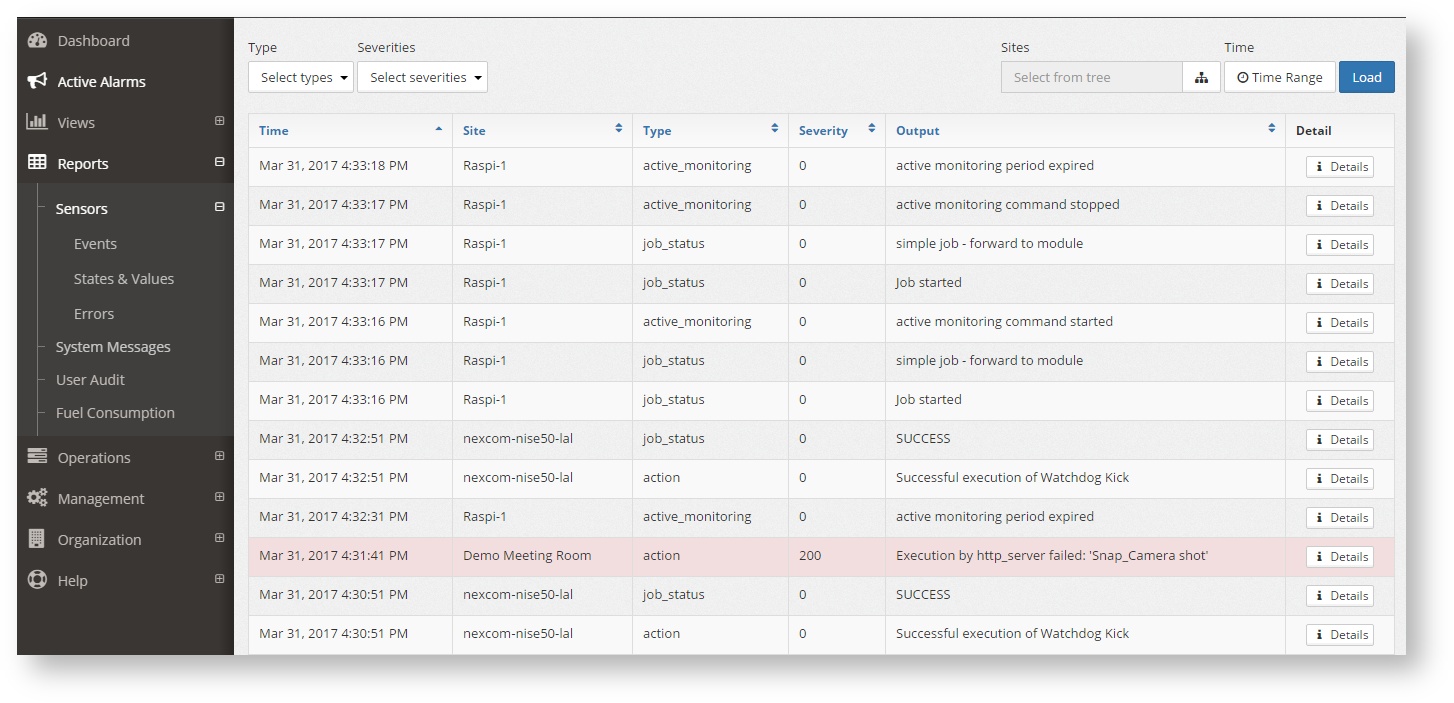
The filters that can be used are:
- Type: Defines the type of system event that is logged. The dropdown only shows the types that are displayed at that moment, The possible types are, amongst others:
- action: An action executed by the local sitecontroller. Can be either remote or triggered by a rule
- active_monitoring: When a user has activated the active monitoring (live monitoring) of the site
- ConfigUpdate: When the system has received a new sensor configuration template.
- job_status: When the system is performing a job, like an update.
- module_state_transition: When a module of the SiteController is starting or stopping.
- rev_info_report: When they local SiteController boots up, it send the rev_info_report, which shows the software version that is running
- time-sync: When the time difference between the gateway and the server is too big. a message like this is shown.
- Severities: The predefined severity of each system event.
- Time Range: Used to select the time range for which the system message will be shown.
- Limit: The maximum number of messages shown in the page. Press the button Load to reload the messages if this parameter is changed.
Clicking on the info button shows the values of the message sent, in its original format.
User Audit
Shows all the actions that the system users haver performed, suchs as logins, changing configurations, deploying them, triggering remote actions, etc.
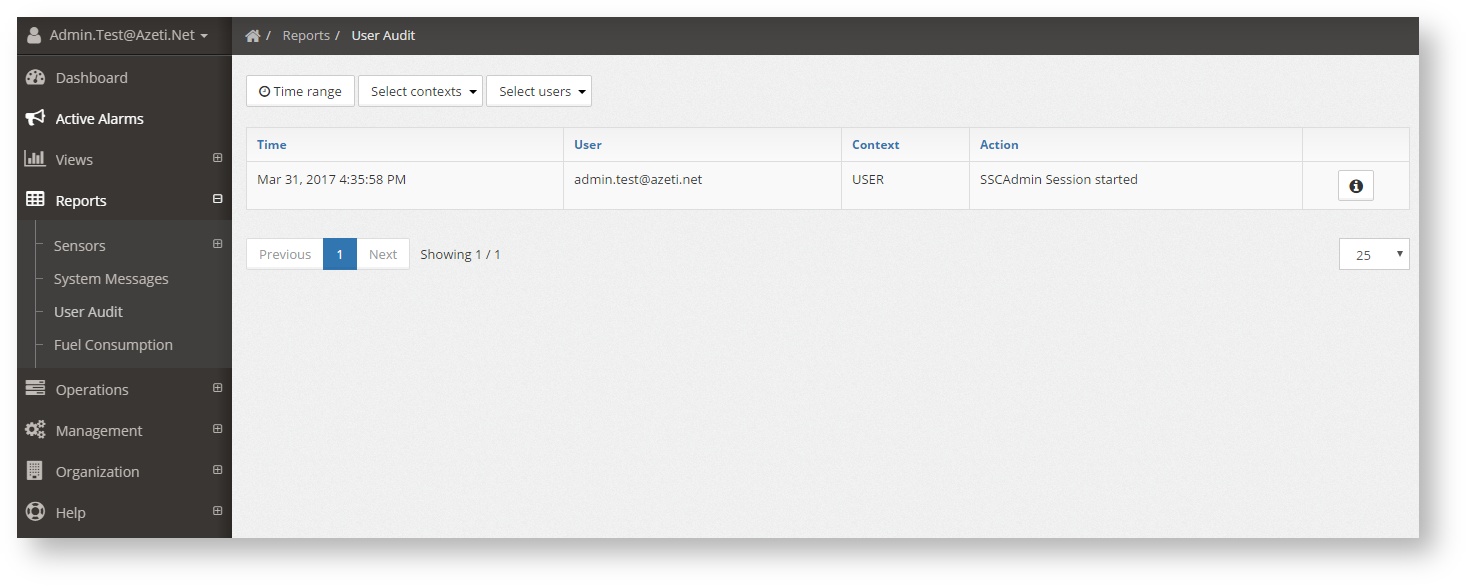
The audit log can be filtered by:
- Time Range: To select the time period for which the events will be shown
- Context:
ORG: Changes done to the organization settings
CU: Actions over the sensor data, such as deleting the historical data
LOCATION: Changes the location information, suchs as name, coordinates, etc.
USER: A user access to the system
ACTION: A remote action triggered by a user
ACCESS_CONTROL: Acces codes deployed to the sites
DEPLOYMENTS: Config changes sent to the locations
- Users: Filter by the user that performed the action.
The list will show all the actions, who performed them, at what time, and the type. Clicking the info button (![]() ) shows more details.
) shows more details.