| Section | |||||||||||||||||||||||||||||||||||
|---|---|---|---|---|---|---|---|---|---|---|---|---|---|---|---|---|---|---|---|---|---|---|---|---|---|---|---|---|---|---|---|---|---|---|---|
|
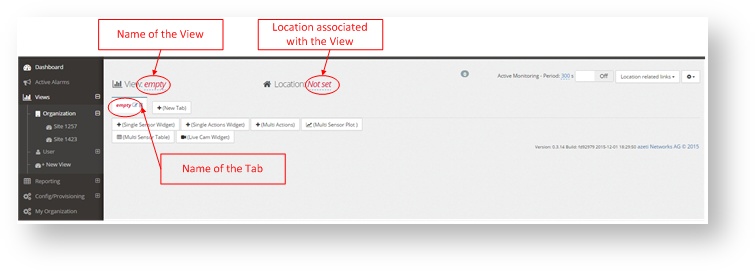
Creating a View
To create view click on +New View on Views
Once done that fill the name of the view, the location associated with the view and the name of each tab that will be set. Create as many tabs as needed.
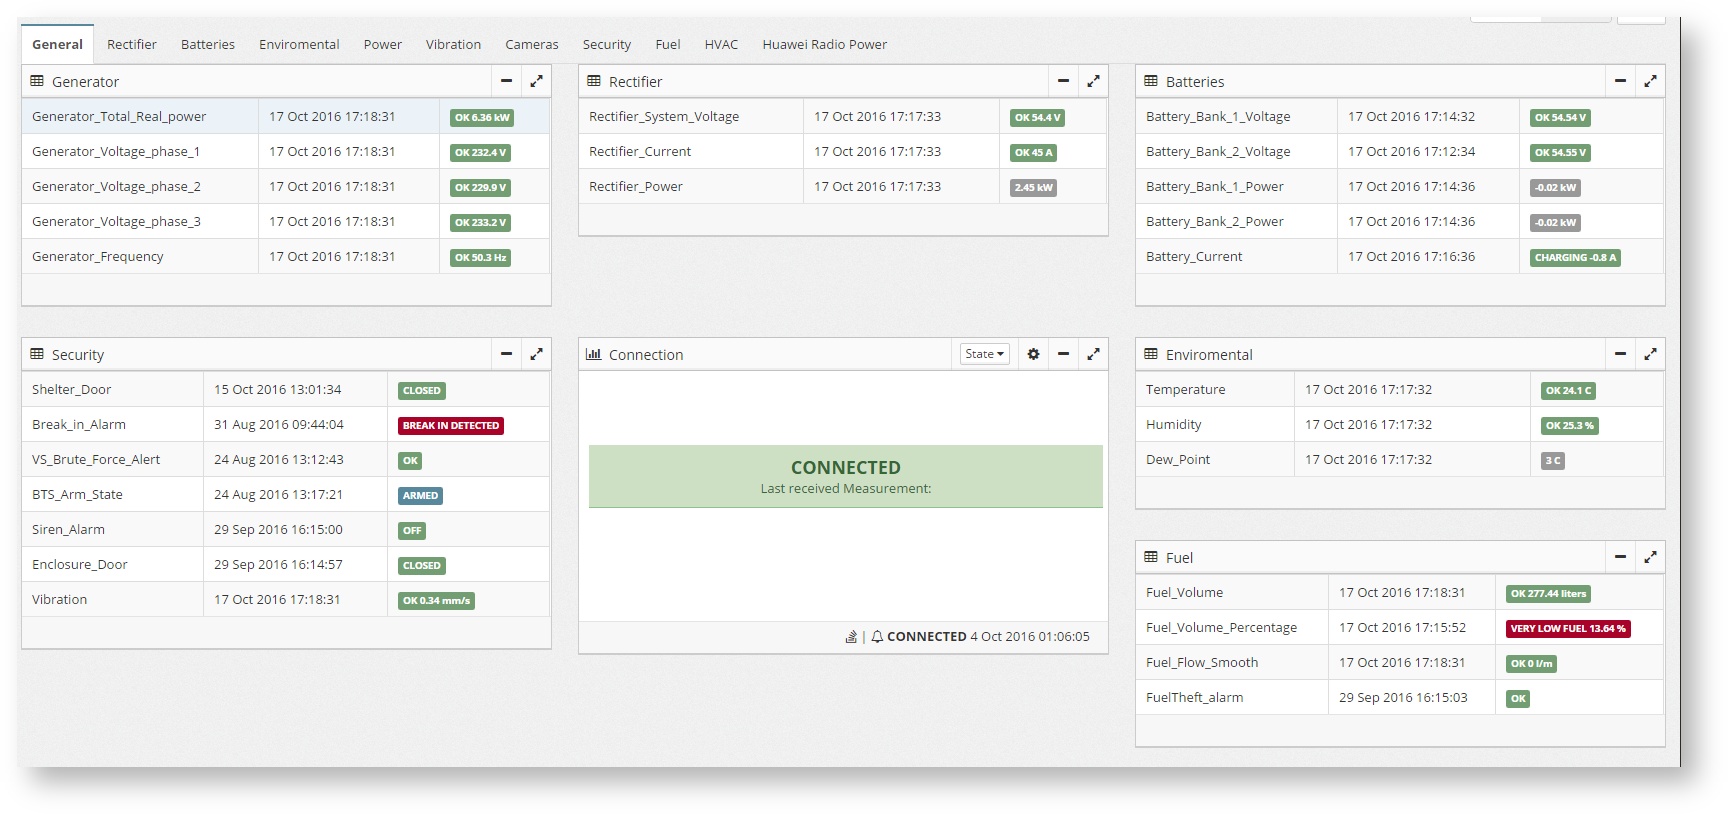
Widgets
On the views the data is shown in widgets.
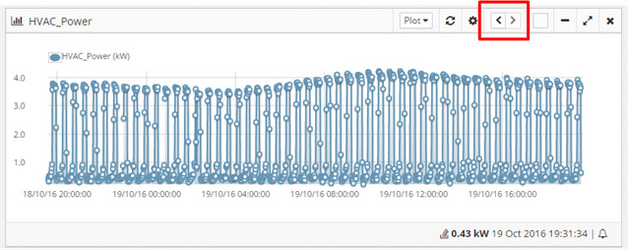
Moving the Widgets
To move the widgets around, change to edit mode and use the left and right arrows on the top of the widget. Move them until they reach the desired position and then save the view.
Widget Types
The widgets can be off the following types
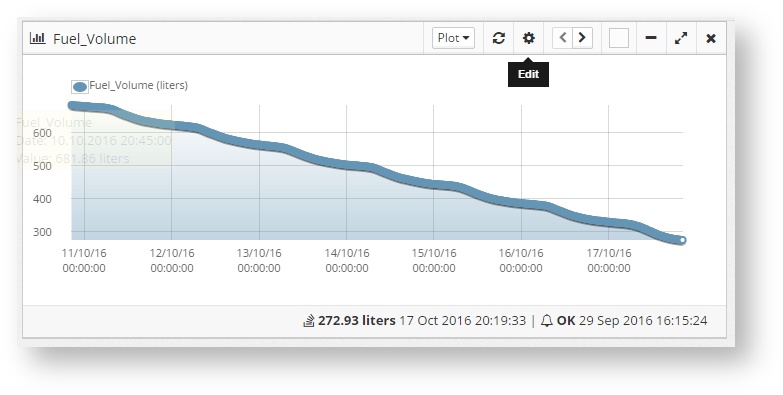
Single sensor widget
Shows only the values of one sensor. It can show the state, a list of values, a graph (plot) or a historic graph history. Select them by using the drop down on the top of the widget
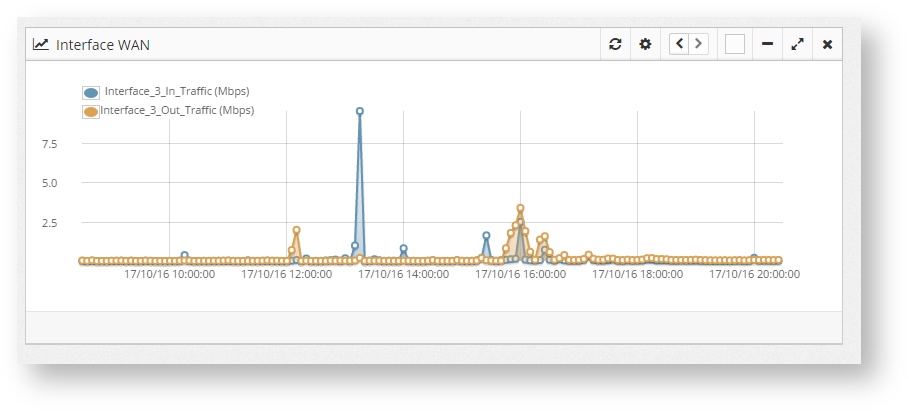
Multi sensor plot
Shows the graph for different sensors on the same widget
Single Actions
Shows a button for the corresponding configured action
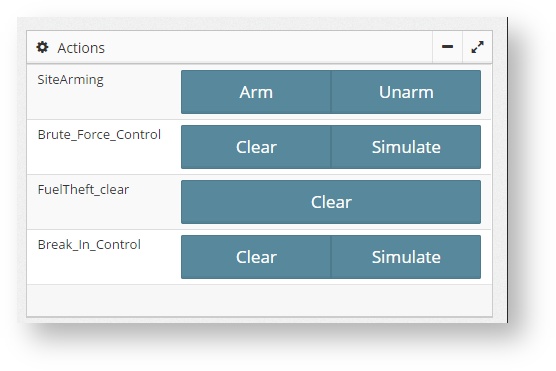
Multi Actions
Shows several buttons for multiple actions
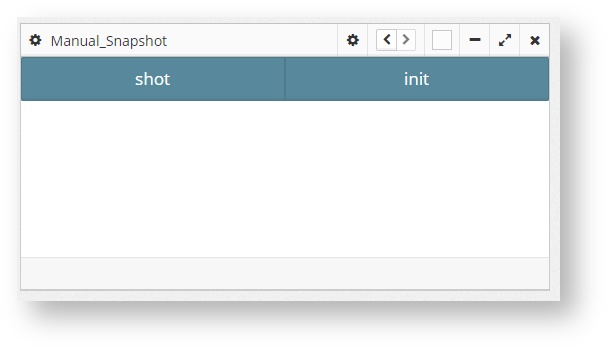
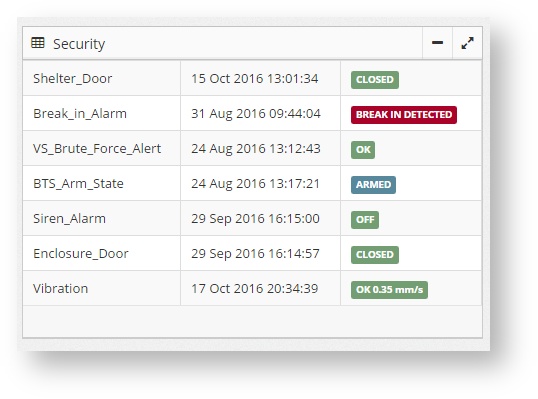
Multisensor table
Shows the state and/or value of several sensors under the same widget
Widget Configuration
Once the Widget is added, it can be configured by pressing the config button on the top right corner.
...
- The width of the widget
- The Title
- The sensor (or sensors) from which the data will be taken
- The criteria to limit the size of the data
- Grouping info for the Plot type. With this the data can be grouped by periods of time through different methods, like the average (mean), maximum, minimum, etc.
Moving the Widgets
To move the widgets around, change to edit mode and use the left and right arrows on the top of the widget. Move them until they reach the desired position and then save the view.
...
Live Video Widget
One special kind of widget is the Live Video one. This only work with the WebVLC plugin. To configure it the user must include the RSTP/RTP URL of the stream from the camera that wants to show.
...