| Section | ||||||||||||||||||||
|---|---|---|---|---|---|---|---|---|---|---|---|---|---|---|---|---|---|---|---|---|
|
Navigation Tree
Then Navigation Tree is located on the left hand side of the screen.
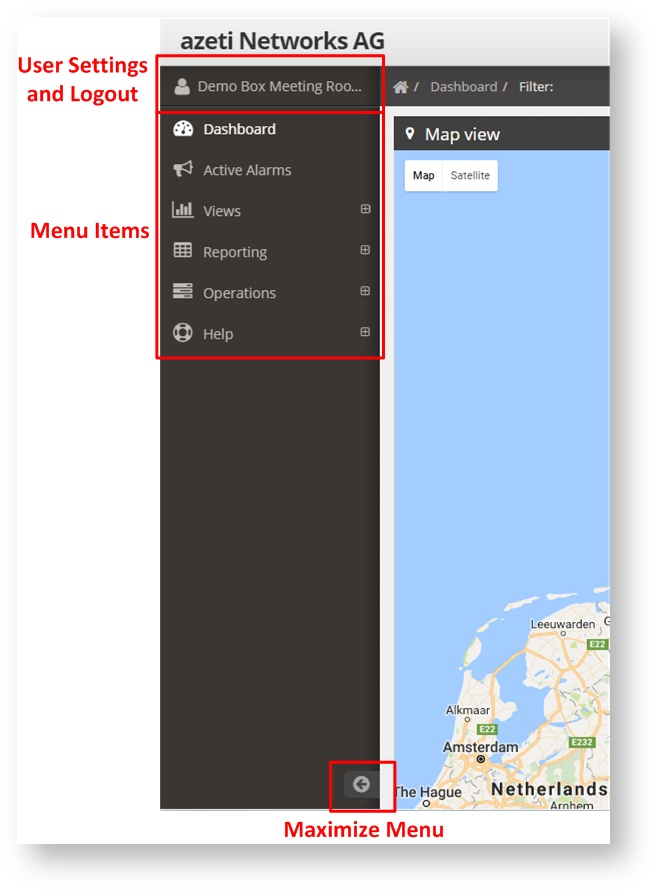
With this menu the user can:
- Show the User Settings or Logout, but clicking on the user name
- Go to the different menu items. These items are different for Operators, Admins and SuperAdmins
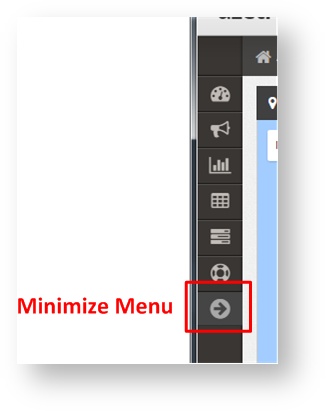
- Minimize the Menu, by clicking on the bottom arrow.
If the menu is minimized, it is still accessible, but only the menu items icos will be shown. By clicking on each of them the full submenu is shown again. To maximize the menu again click on the arrow.
User Options
By clicking on the user name, the user menu will be shown:
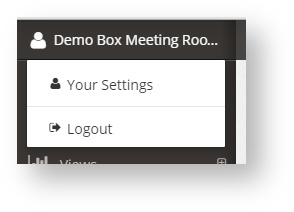
This will allow the user to:
...
By clicking Your Setting the user config menu will be shown. This menu has different tabs:
...
Settings, where the user can select the language, enable/disable the sounds and popup notifications, and the timeout. To disable the timeout set it to -1.
| Warning |
|---|
Setting the timeout -1 means that the session will never be closed by the system. If a user closes it's browser and opens it again, the session will still be open and the system accessible with the last user privileges. This can be a security risk under certain scenarios. |
...
Location Tree and Search Box
On the top right corner can be found the search box, with a few other buttons
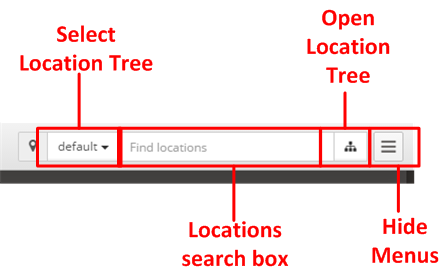
The search box allow the user to look for any site in the network. It is case insensitive and will auto fill with all the possible names. Once the user selects one site it will be taken directly to the Site View.
Other buttons available.
- Hide Menus: When clicking this button, all the menus, (Navigation Tree and Locations trees) will be hidden. To show them again press the same button
- Select location tree: This will allow the user to select which location tree to use. There can be several on one organization
- Open Location tree: Once pressed, the Location Tree will be open on the right hand side of the screen
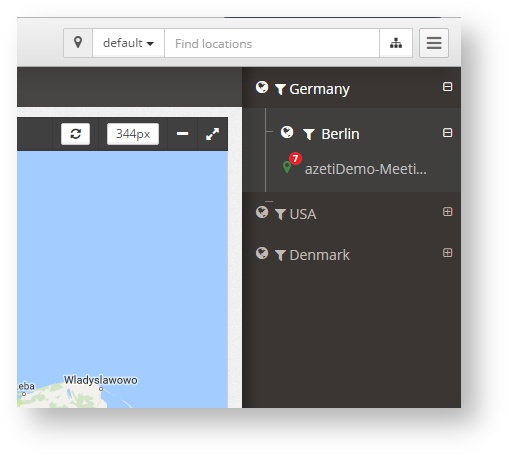
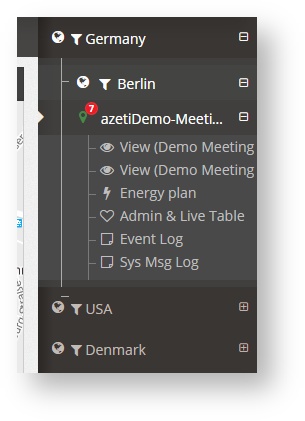
The location tree shows all the locations in a predefined tree (which is configured by the Administrator). It can have several levels, and at the bottom there is always the sites. On the site the menu shows all the visualization options available.
...
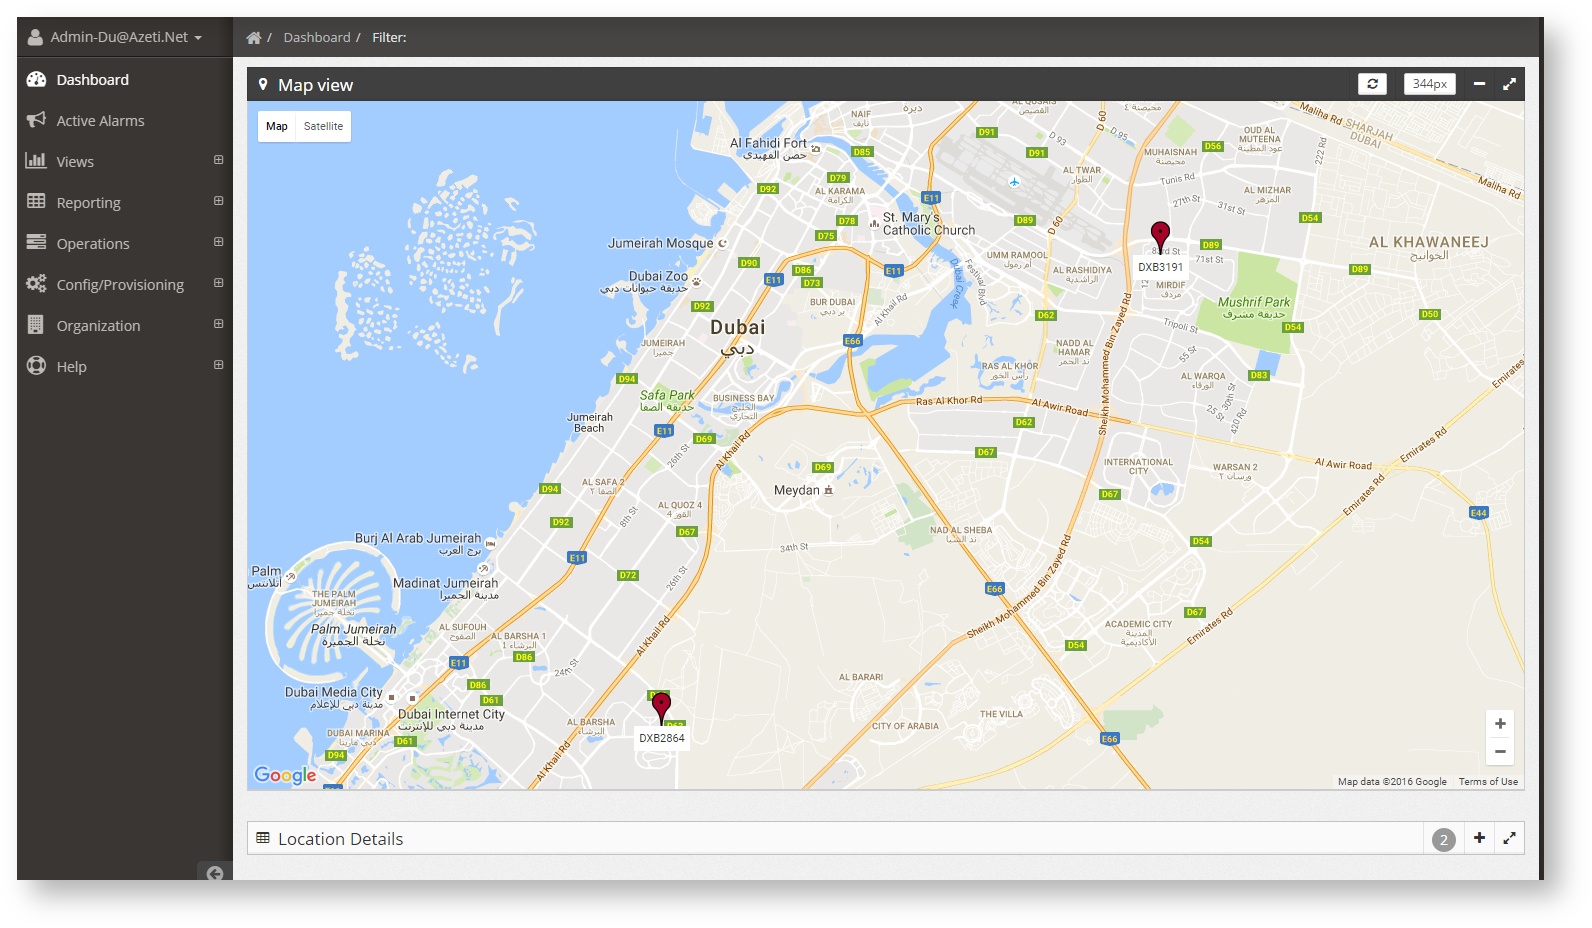
Map View
The map view shows all locations over a map, with direct link to all the locations functions.
When clicking on a site location, a menu is displayed with a direct link to the following features:
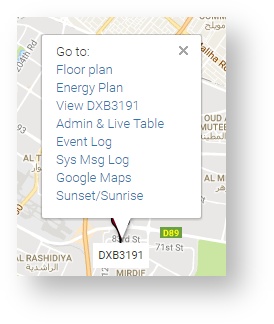
- Floor plan: If a floor plan has been uploaded it will show it here, with the sensor values superimposed
- Energy plan: Showing an energy flow diagram for the site (if it has been uploaded)
- View: It will lead directly to the first view associated with this sites (more on views on Views section)
- Admin & Live Table: a table that shows all location sensor, with the possibility to receive live data (see Admin & Live Table section)
Event log (see Reporting section)
Sys Msg Log (See Reporting section)
Locations List
To show it press the + sign at the bottom right of the screen. This list shows all the locations with:
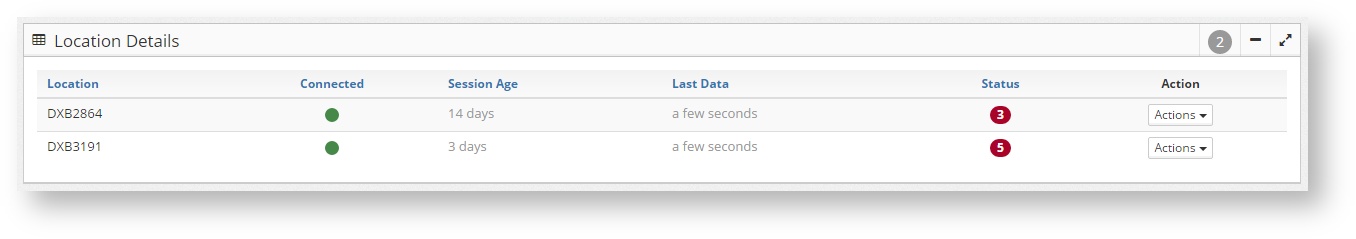
- The location name
- The connection status (connected or not connected)
- Session age: For how long it has been connected the last time
- Last Data: When it was the last time that received data
- Status: The status of the site. This is displayed by a colour: red means there are alarmed sensors, green no alarmed sensor, and the number inside is how many alarms sensors are in the site.
- An action button with several options related to the site:
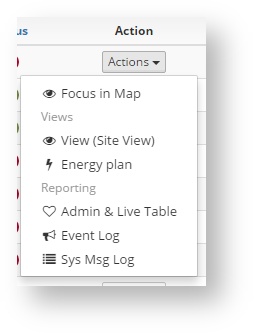
- Focus in Map: Focus the dashboard map on the the site location
- View: Goes to the default view of the site (see Views)
- Energy Plan: Shows the energy plan of the site (if loaded)
- Admin & Live table (see Admin & Live Table)
Event log (see Reporting section)
Sys Msg Log (See Reporting section)