...
Shows all the historic list of sensor events (or alarms) for a specific site. In the top right corner to total number of events can be seen.
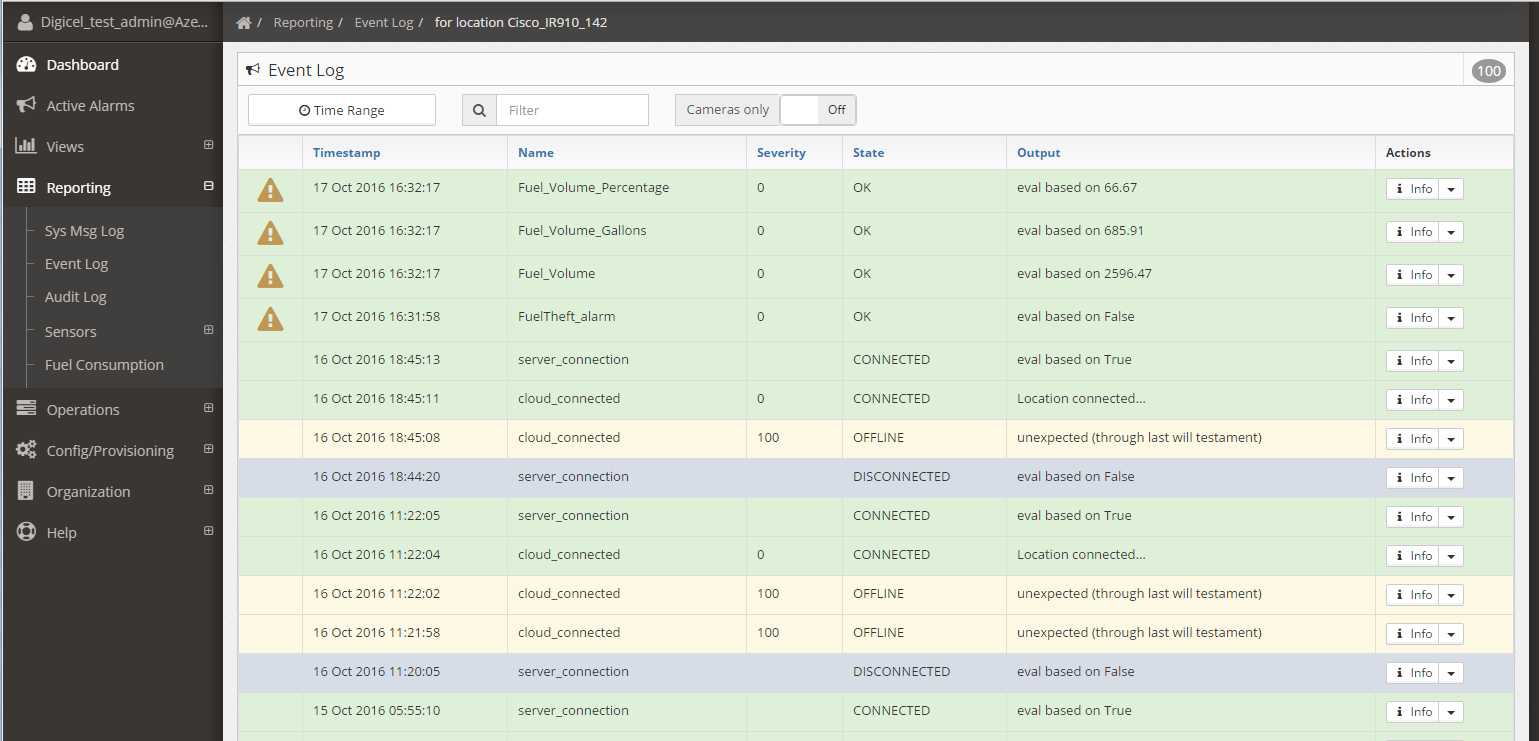
The event list can be filtered by:
- Time Range: To select the time period for which the events will be shown
- Filter: This is a free text filter that is applied to all the fields. Can be the sensor name, the sensor state, the sensor output. Case sensitive.Name, State, Output: This filter will apply to the Name, State and Output values, showing only the ones that match.
- Severities: Show only events of the selected severity
- Cameras only: Shows only the sensor that have an image associtated. Hovering over the camera icon (
 ) shows the picture.
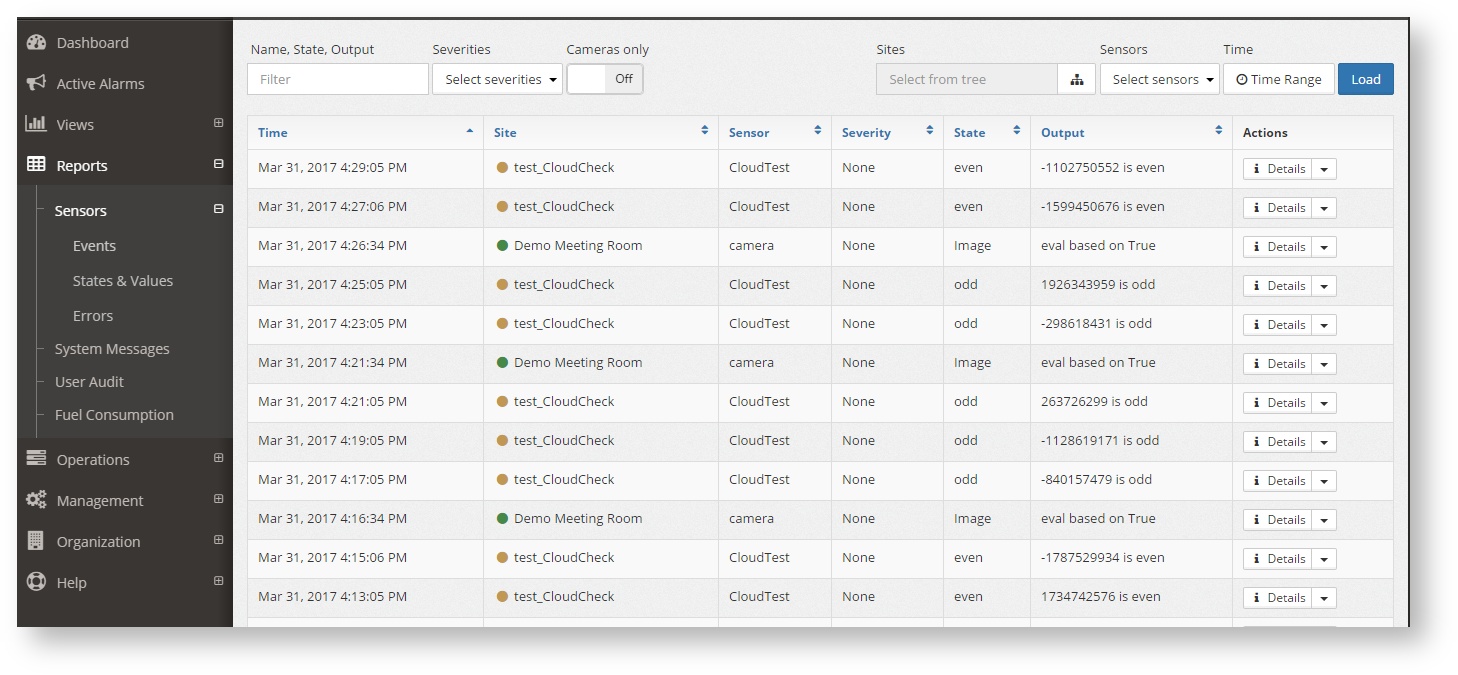
 - Sites: pressing the button will show the location tree that allows to filter the alarms by location or region (as defined on the location tree)
- Sensors: Sensor name. Select from the drop down or use the autofill text box.
- Time Range: To select the time period for which the events will be shown.
To reload the whole report using the same select filter press the button "Load"
States & Values
Shows the last status of a specific sensor across all sites
...
Shows the system messages for a specific site. Once in the report a site has to be selected, unless the location menu has been used to get to the report.
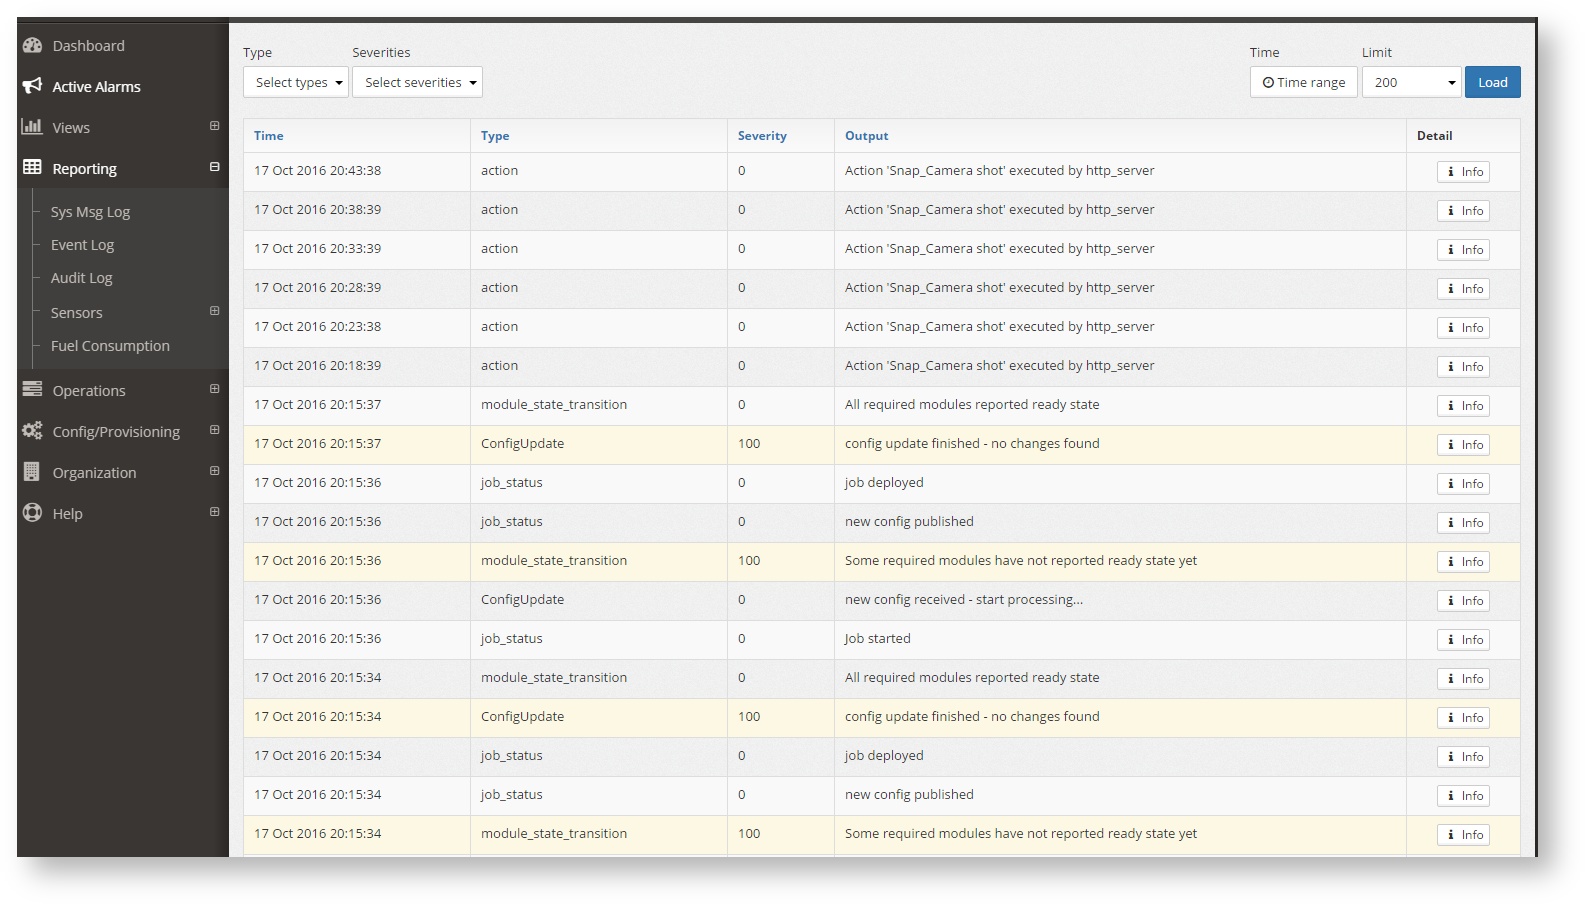
The filters that can be used are:
...
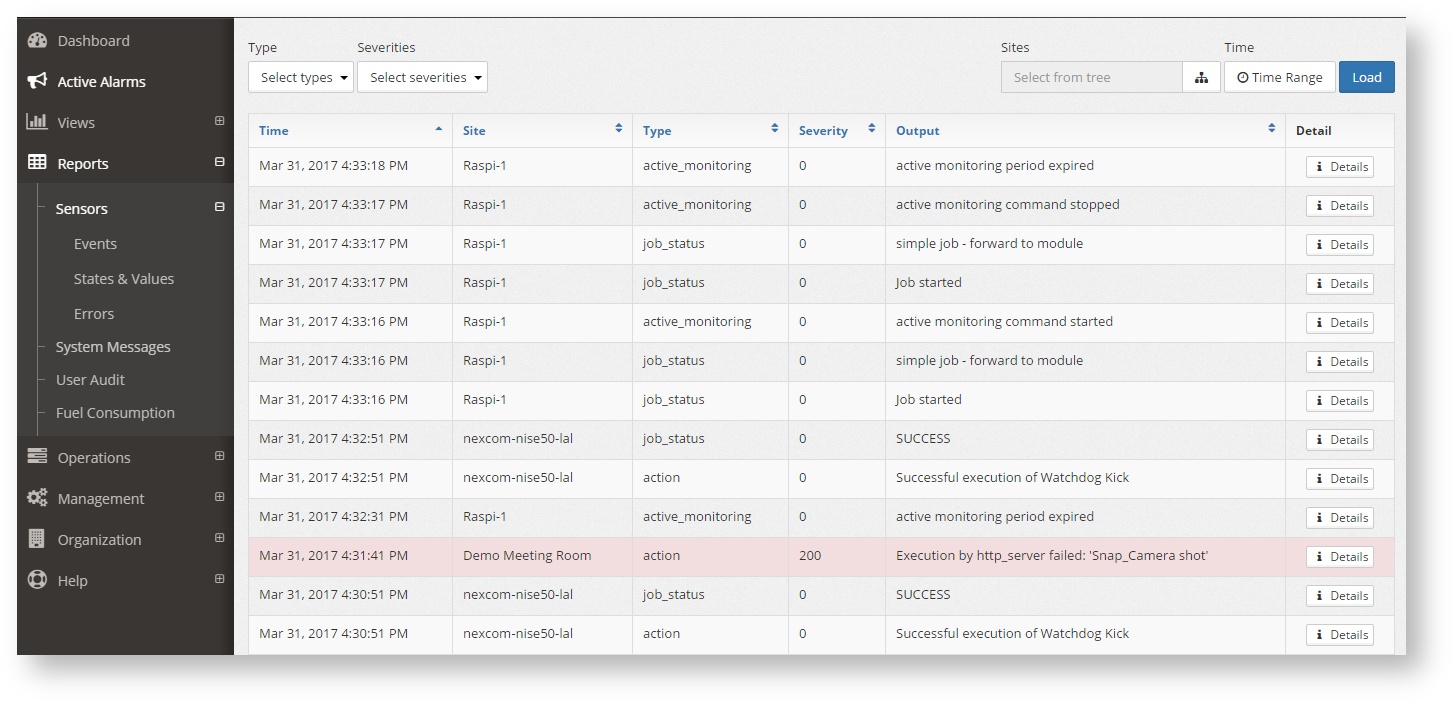
Shows all the actions that the system users haver performed, suchs as logins, changing configurations, deploying them, triggering remote actions, etc.
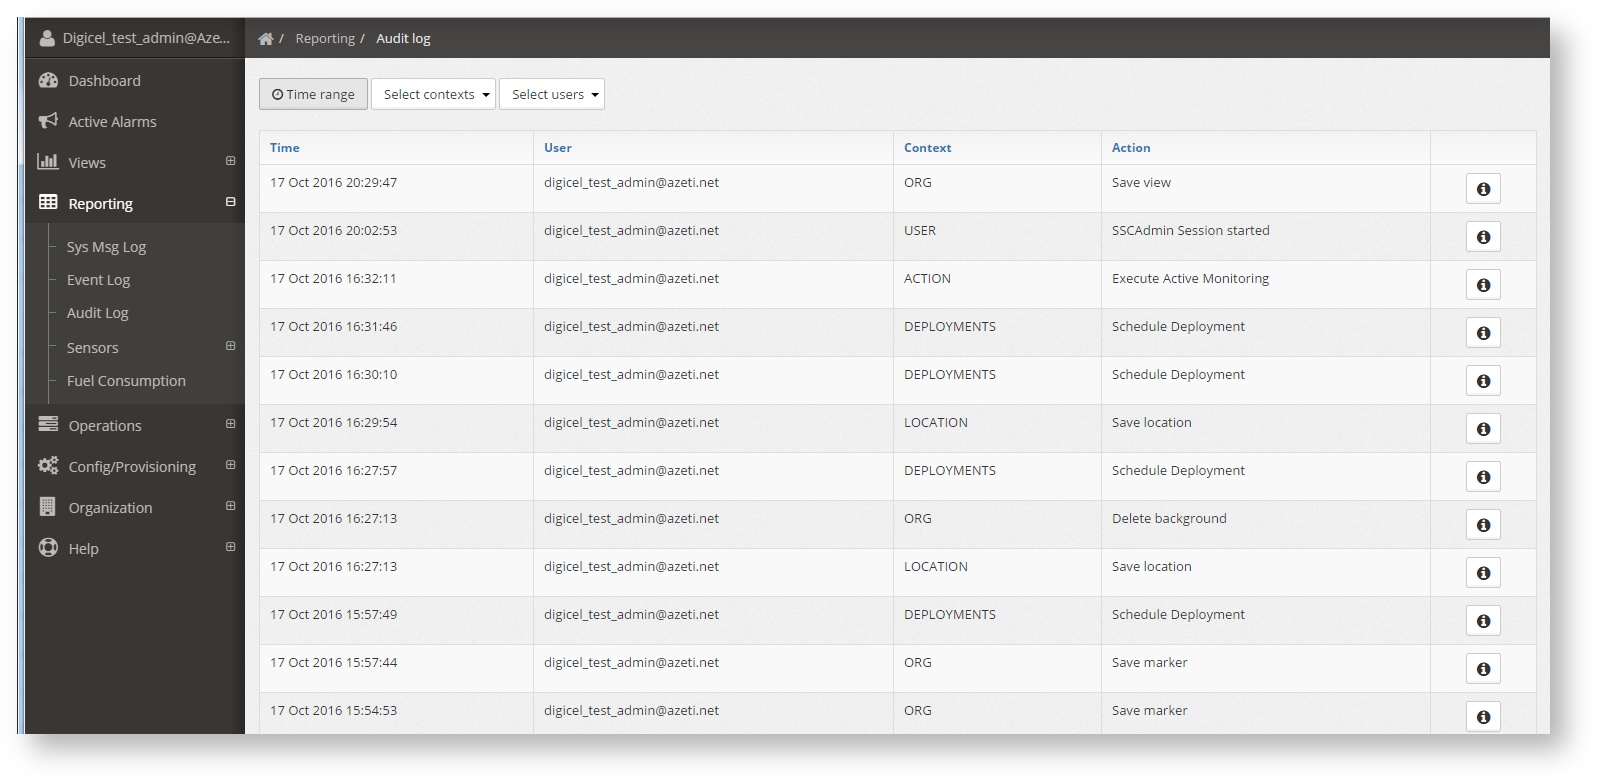
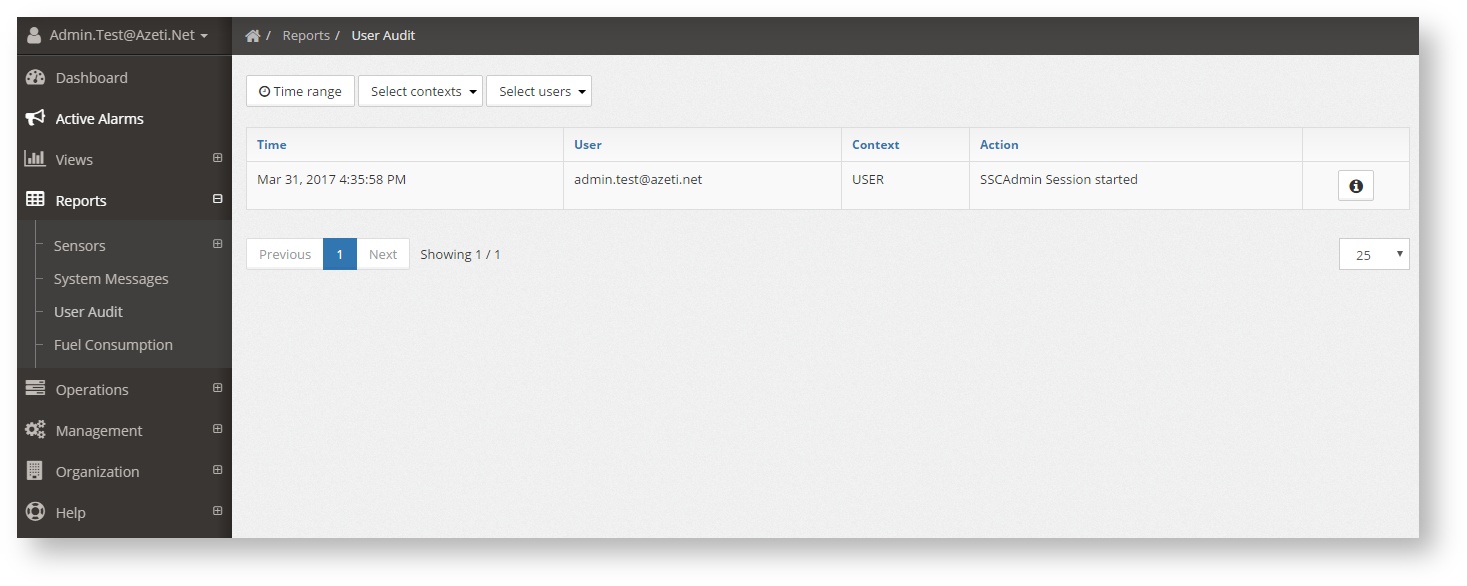
The audit log can be filtered by:
...