...
...
...
...
| Section |
|---|
| Column |
|---|
| Views are the customizable dashboards used to show graphs or sensor information in one page. The Views are created and edited by the admin users, and there are two kind: - Organization views: Accessible to all users of the organization, whether they are Admins or Operator
- User views: Only accessible to the user that created it
Accessing the viewsThere are different ways to access the views: - Through the left menu: go to Views and expand the Organization (for Organization Views) or User (for User Views). If the view is a a multisite view the selection tree will be shown to select the correct location
- Through the location tree
- Through the dashboard map
|
| Column |
|---|
|
| Panel |
|---|
| borderColor | lightgrey |
|---|
| bgColor | #f0f0f0 |
|---|
| title | On this page: |
|---|
| |
|
|
...
To move the widgets around, change to edit mode and use the left and right arrows on the top of the widget. Move them until they reach the desired position and then save the view.
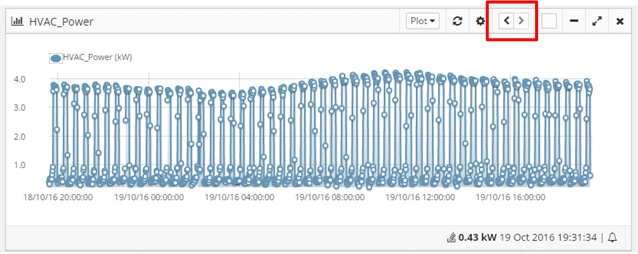 Image Removed
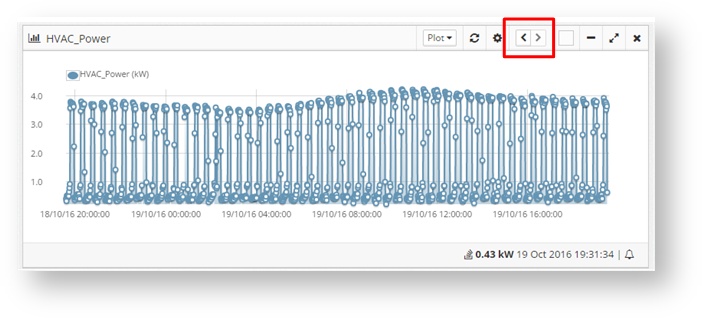 Image Added
Widget Types
The widgets can be off the following types
...
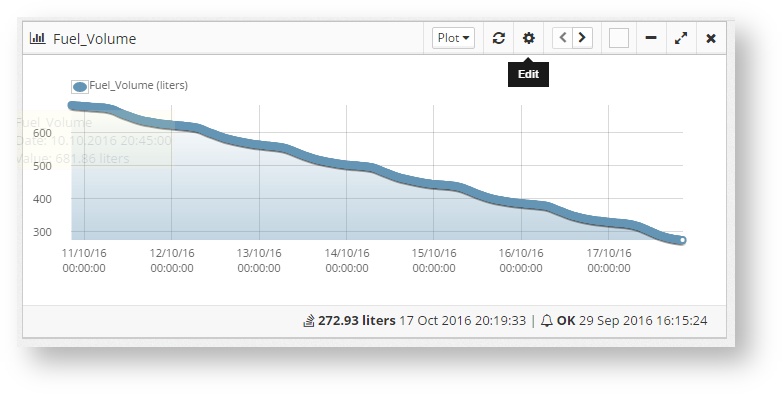
Shows only the values of one sensor. It can show the state, a list of values, a graph (plot) or a historic graph history. Select them by using the drop down on the top of the widget
Multi sensor plot
Shows the graph for different sensors on the same widget
...
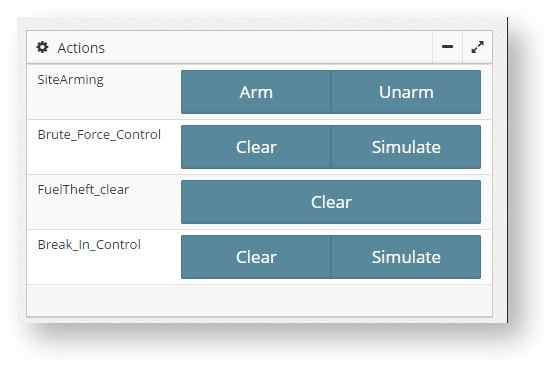
Shows several buttons for multiple actions
Multisensor table
Shows the state and/or value of several sensors under the same widget
...