...
There is more than one way to access it.
- Organization → Locations → Sites → Click on the name of the location of interest. Only available for Admin users.
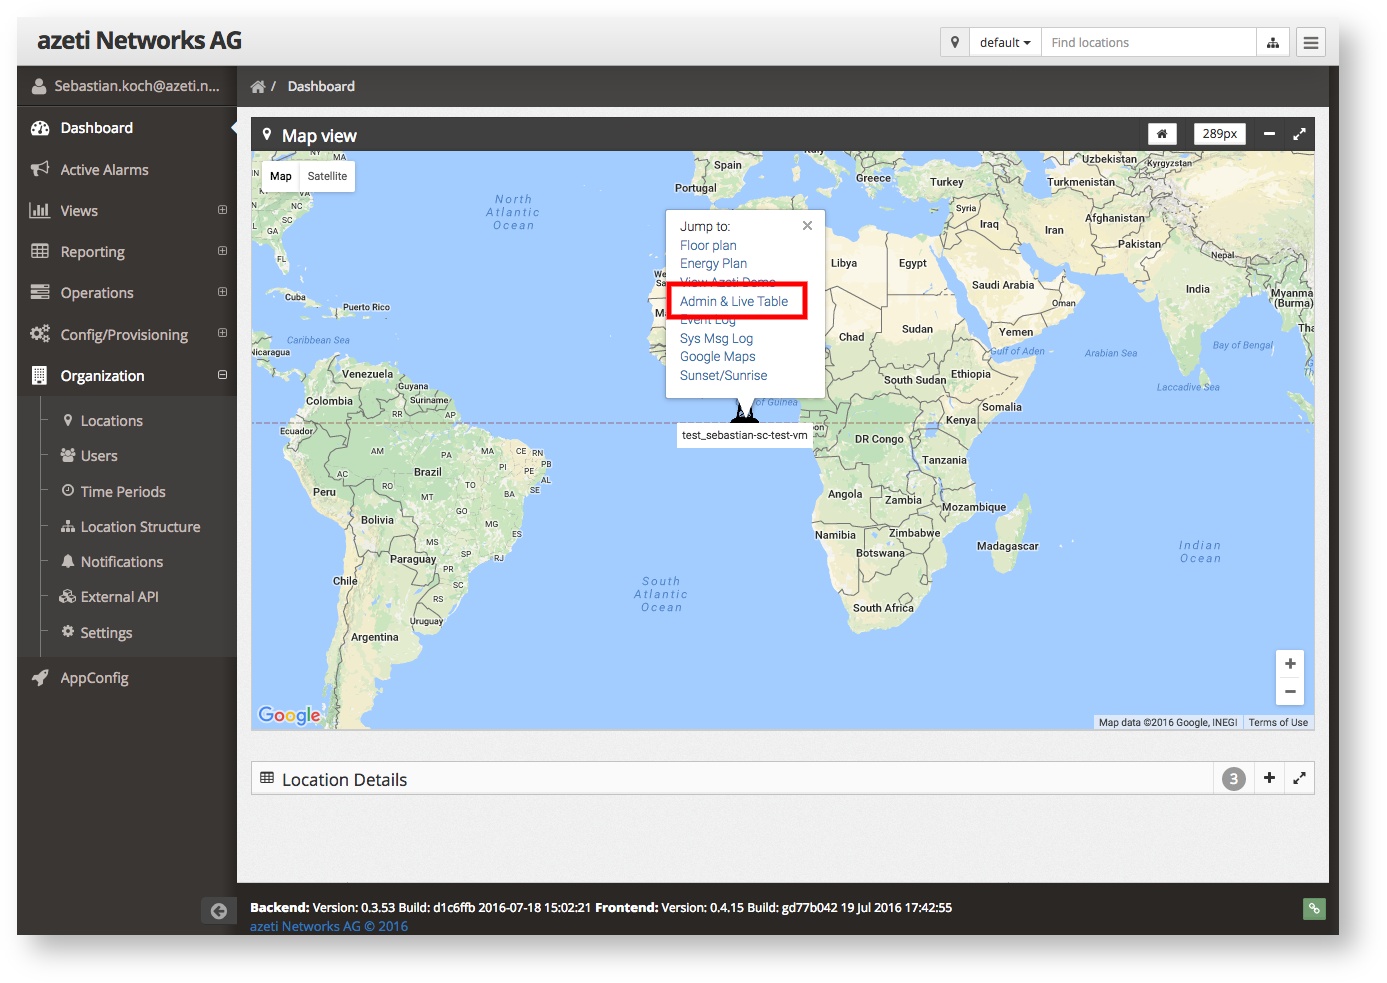
- Dashboard → Map VIew →View → Click on the icon of the location and choose Admin & Live Table
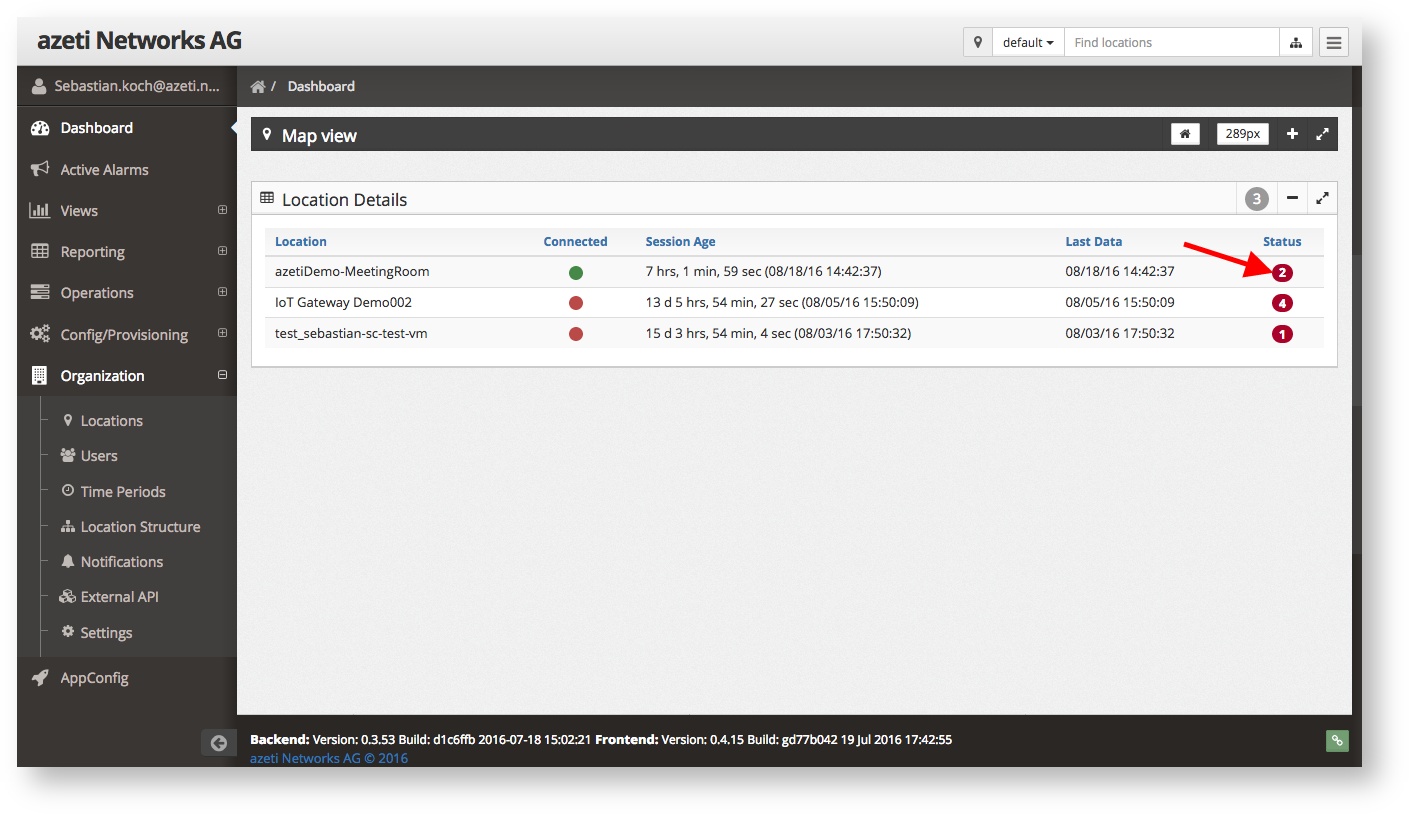
- Dashboard →Sites → Location Details → Click on the circle in the Status row
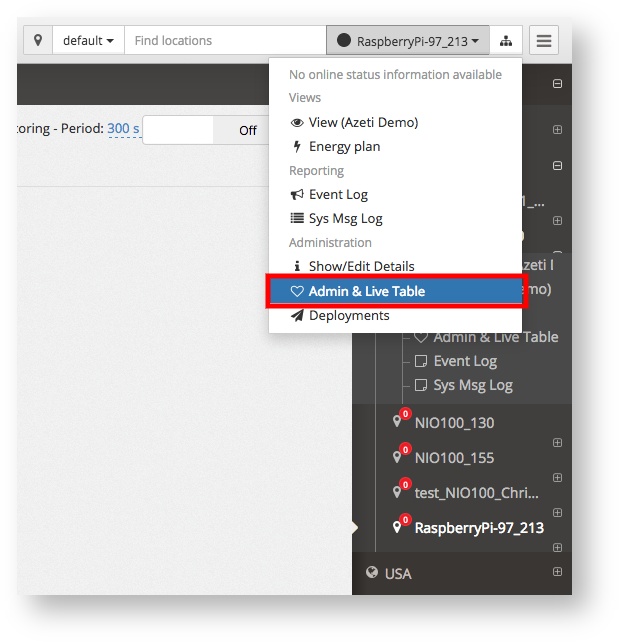
 arrow button on the right end of the row. A menu will appear, select Admin & Live Table
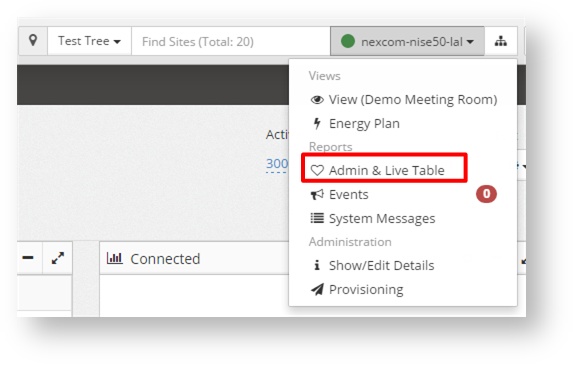
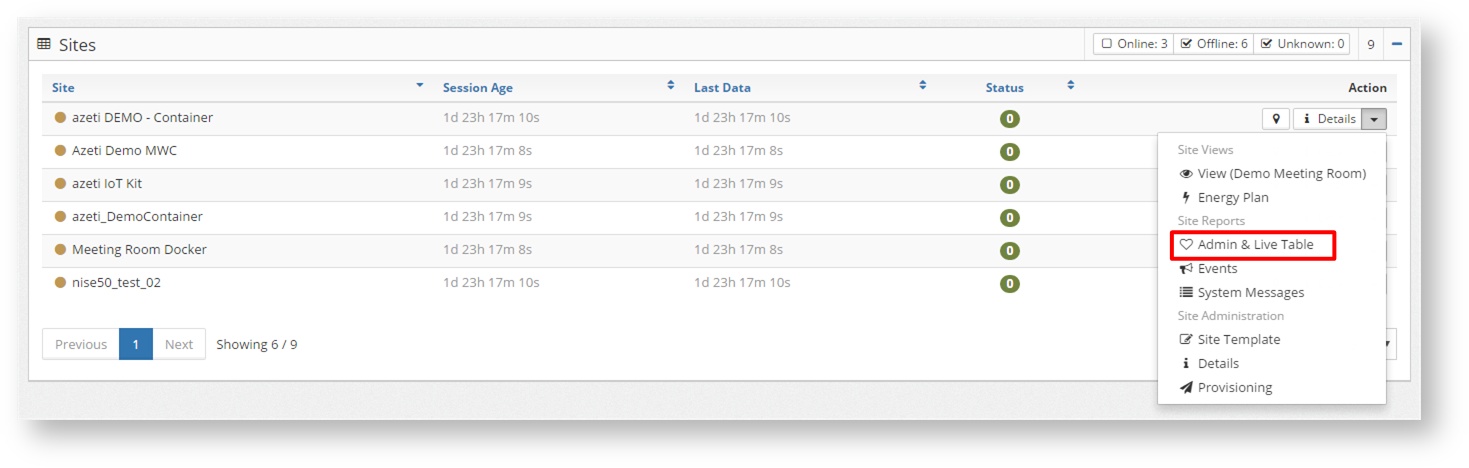
- Open the Location Tree by clicking on
 at the top, choose your location and expand it (+), find Admin & Live Table in the menu
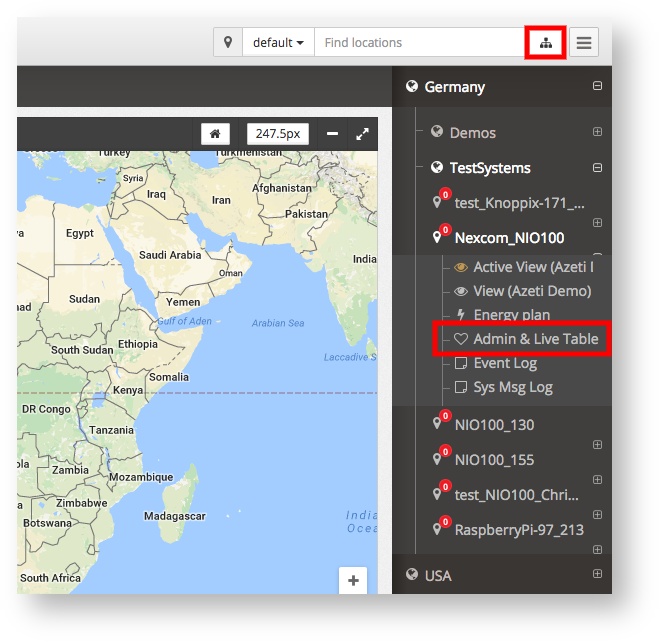
- Search for your location (top search bar) and choose it, open the location menu and choose Admin & Live Table
Usage
Filtering for sensors and values
The Filter function 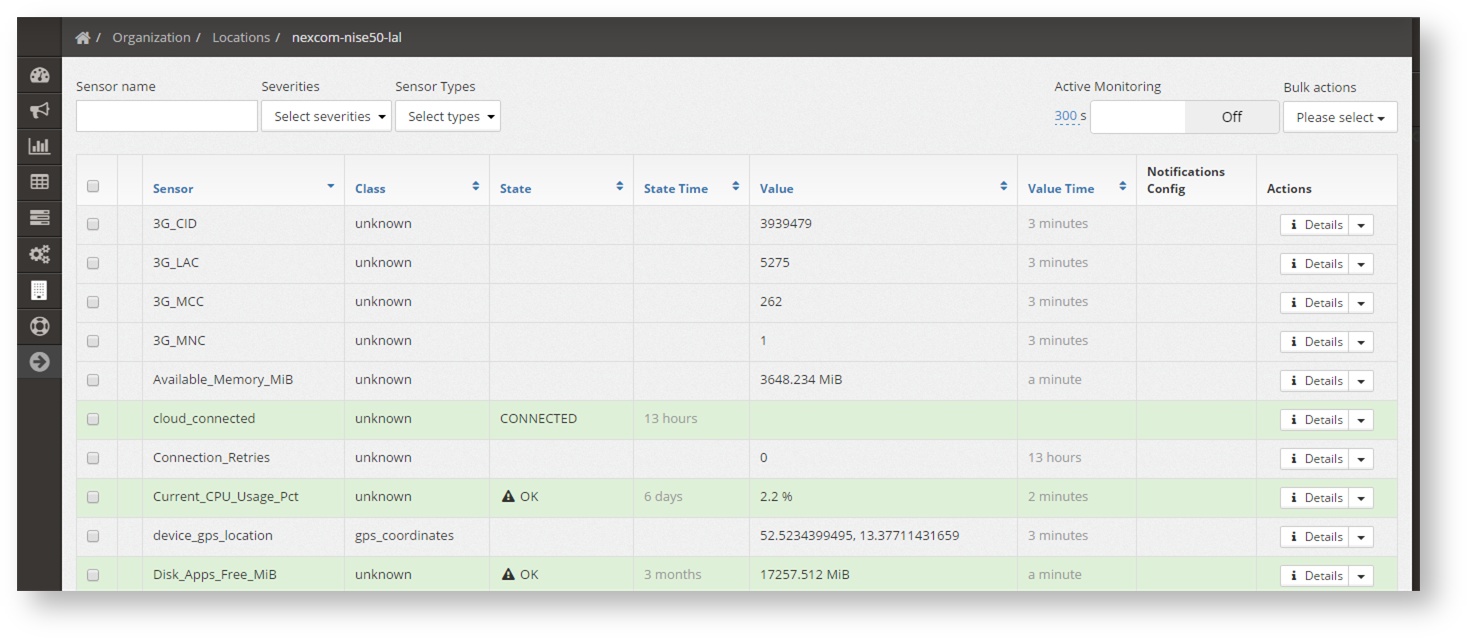
On the top of the table there are several filters that can be used to only show some sensors:
- Sensor Name: allows you to search in any available metric, e.g. search for states, sensor name or values. Type it in and it refreshes the list automatically.
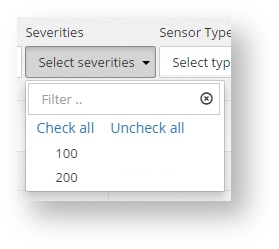
- Severity: Choose the severity to show only the sensor whose current state matches that severity.
- Sensor types:
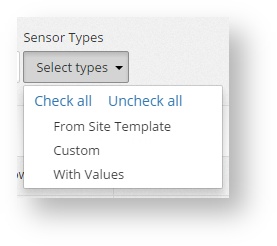
- From Site Template: Show only the sensors that exist in the assigned site template
- Custom: Show only sensors that do not exist on the site template but do have values
- With Values: Show only sensors that are not empty and do have a value
Filtering for sensors and values
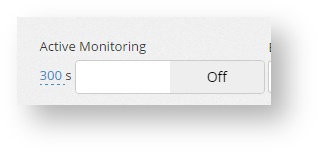
Two actions can be triggered from the Admin & Live table:
- Active Monitoring: By clicking here, the server will send a signal to the location Site Controller. This will change the behaviour of the site controller, and will send the data in real time, as is it is read from the sensor, without wating for the upload interval. This behaviour would last for the amount of time set on the left side of the button. By default is set to 300 seconds (5 minutes), but can be changed clicking on it and moving the slider. The minimum value can 30 seconds and the maximum 600 seconds (10 minutes).
...
- After this interval the SiteController will return to sending that only on the configured upload intervals.
- Bulk Actions: This allows to perform actions on all the sensors that are checked (left side of the sensor). The only available action are the moment is to delete the sensor.
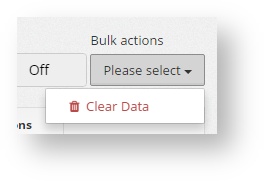
Table field reference
| Tip |
|---|
You can sort the Live Table by any row, simply click on the row header. |
...
| Field | Description |
|---|---|
| Sensor | Name of the sensor |
| Class | Sensor class, describes the type of measurement, some examples:
|
| State | Current sensor state e.g. OK |
| State DurationTime | Elapsed time since this state occured. |
| Value | Measurement result |
Value DurationTime | Elapsed time since value was processed locally |
| Notifications Config | Configured notifications |
...
By pressing on the arrow button on the left of info, a menu showing a few more options is shown:
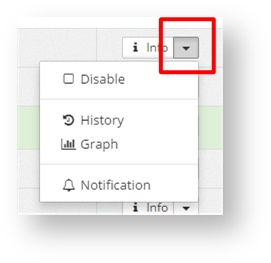
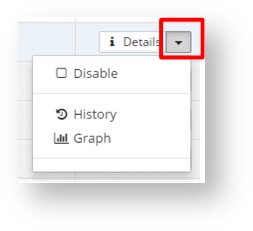
- Disable: It is used to disable a specific sensor on the frontend. After being disabled, a new option to delete it appears. Deleting it means that all the stored info of the sensor, included historic data, will be deleted. It cannot be undone. If the sensor has only been disabled in can be enabled again using the same option
- History: Press it to show a list of historic values and/or states

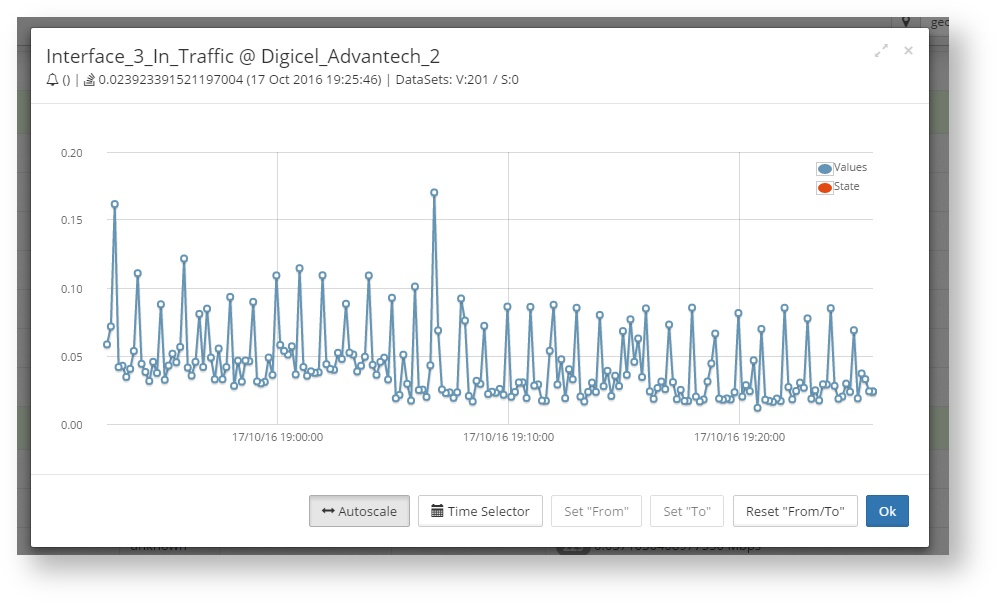
- Graphs: Press it to show a graph of the values and states of the sensor. A time selector can be used to select specfic timeperiods.
 Notifications: To enable the notifications for a specific sensor, change the recipients, or the timeperiods (see Notifications)