...
- Floor plan: If a floor plan has been uploaded it will show it here, with the sensor values superimposed
- Energy plan: Showing an energy flow diagram for the site (if it has been uploaded)
- View: It will lead directly to the first view associated with this sites (more on views on Views section)
- Admin & Live Table: a table that shows all location sensor, with the possibility to receive live data (see Admin & amp; Live Table section)
Event log (see Reporting section)
Sys Msg Log (See Reporting section)
...
To show it press the + sign at the bottom right of the screen. The list can be filtered by the connection state of the location: Online, Offline, Unknown. Use the checkbox to select which ones to show. By default only the ones Offline or Unknown will be shown.
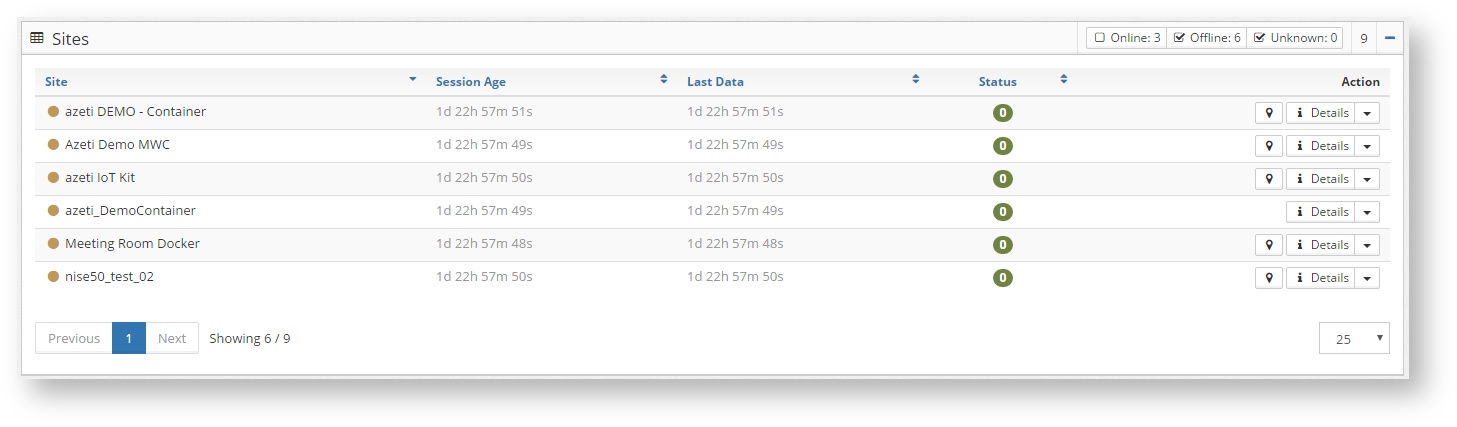
This list shows all the locations with:
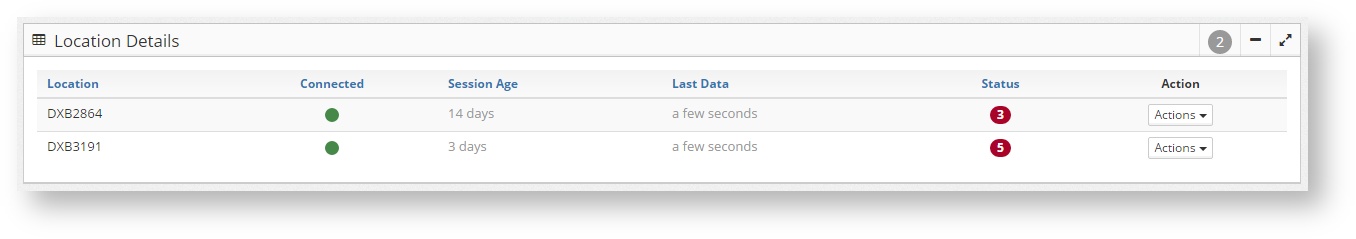
- The location name
- The connection status (connected or not connected)
- Session age: For how long it has been connected the last time
- Last Data: When it was the last time that received data
- Status: The status of the site. This is displayed by a colour: red means there are alarmed sensors, green no alarmed sensor, and the number inside is how many alarms sensors are in the site.
On the right side of the list there are several buttons that can be pressed:
- A focus on location button
 . If pressed will focus the dashboard map on the location coordinates.
 - A details button
 that will show the raw data in json format.
 - An action button with several options related to the site:
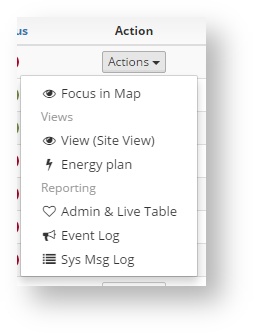
Focus in Map: Focus the dashboard map on the the site location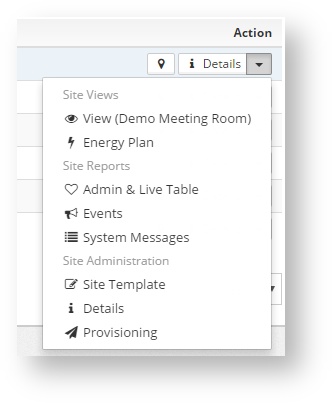
- View: Goes to the default view of the site (see Views)
- Energy Plan: Shows the energy plan of the site (if loaded)
- Admin & Live table (see Admin & amp; Live Table)
Event log Events (see Reporting section)
Sys Msg System Messages Log (See Reporting section)
- Site Template (see Configuration And Provisioning)
- Details (see Organization Configuration and Management)
- Provisioning (see Configuration And Provisioning)