| Section | ||||||||||||||||||||
|---|---|---|---|---|---|---|---|---|---|---|---|---|---|---|---|---|---|---|---|---|
|
...
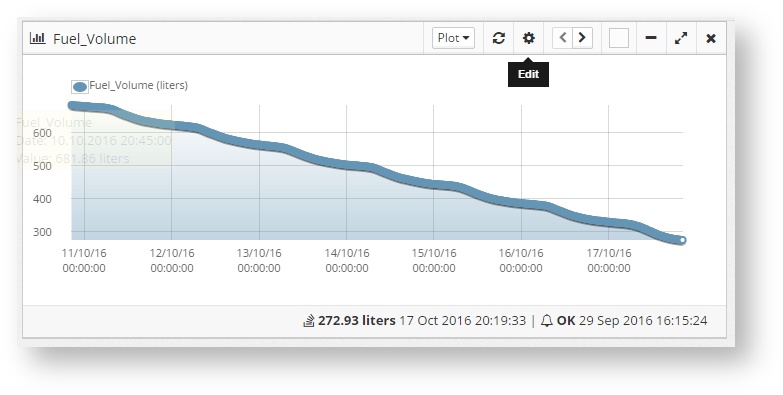
Shows only the values of one sensor. It can show the state, a list of values, a graph (plot) or a historic graph history. Select them by using the drop down on the top of the widget
Multi sensor plot
Shows the graph for different sensors on the same widget
...
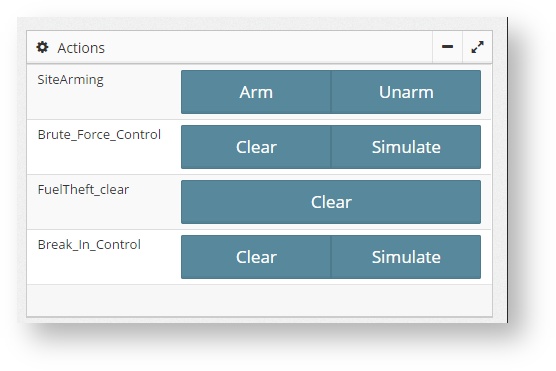
Shows a button for the corresponding configured action
Multi Actions
Shows several buttons for multiple actions
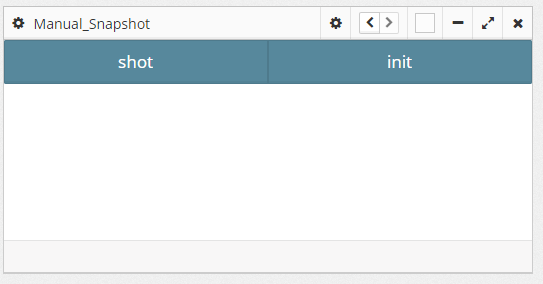
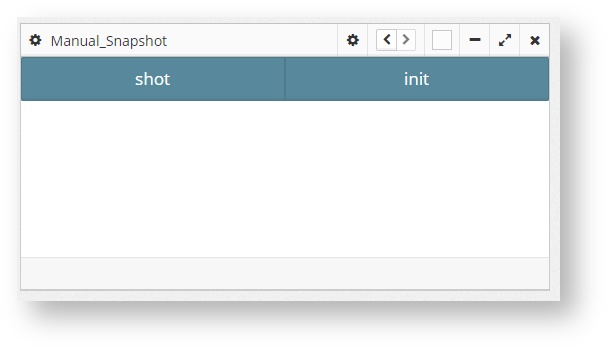
Multisensor table
Shows the state and/or value of several sensors under the same widget
...