...
| Section | ||||||||||||||||||||
|---|---|---|---|---|---|---|---|---|---|---|---|---|---|---|---|---|---|---|---|---|
|
...
Sensors
Events
Shows all the historic list of sensor events (or alarms) for a specific site. In the top right corner to total number of events can be seen.
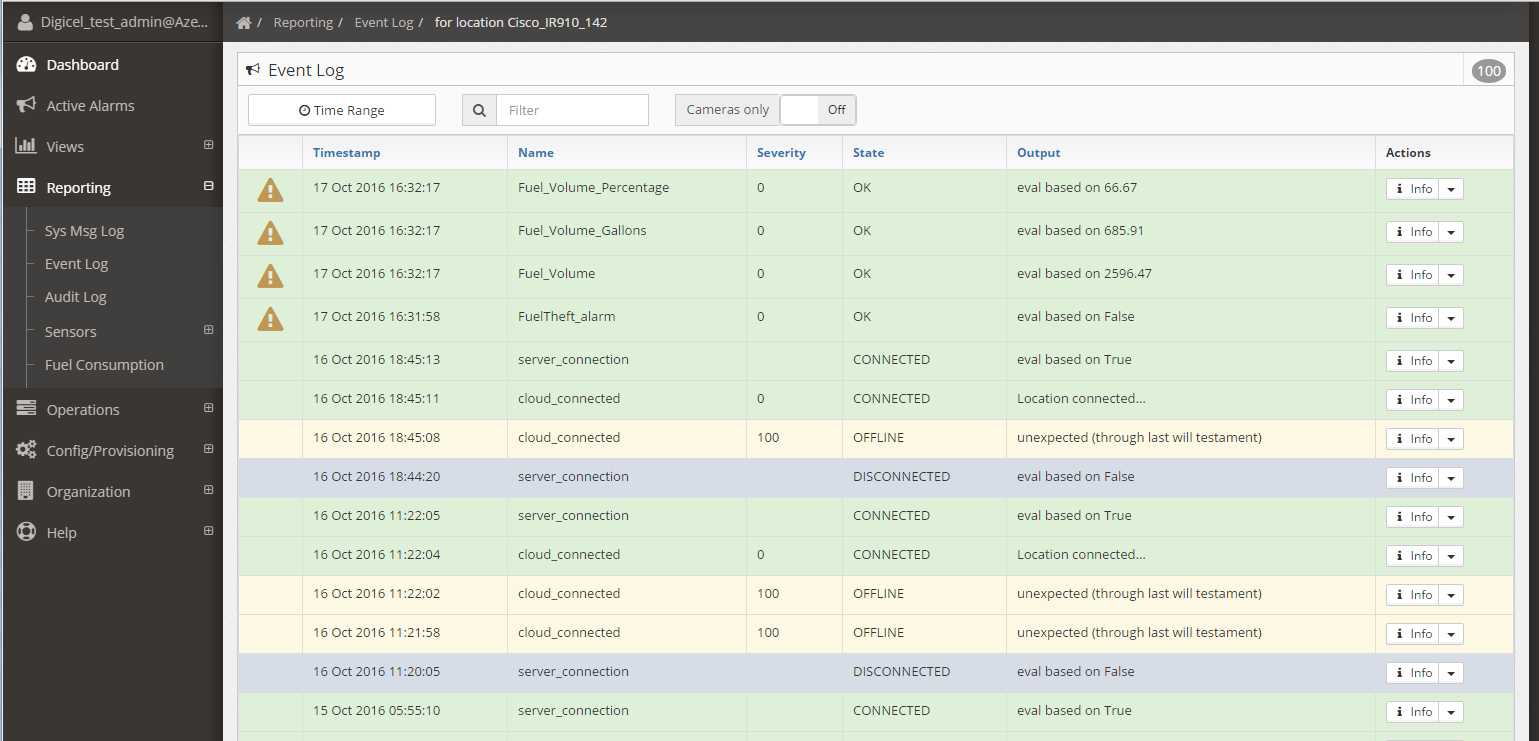
The event list can be filtered by:
- Time Range: To select the time period for which the events will be shown
- Filter: This is a free text filter that is applied to all the fields. Can be the sensor name, the sensor state, the sensor output. Case sensitive.
- Cameras only: Shows only the sensor that have an image associtated. Hovering over the camera icon (
 ) shows the picture.
States & Values
Shows the last status of a specific sensor across all sites
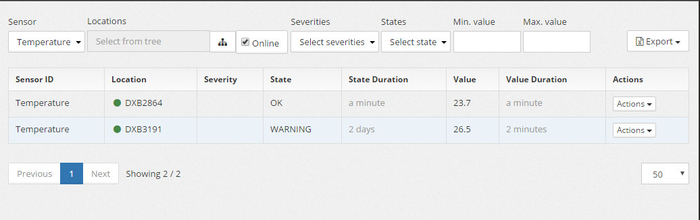
A sensor has to be selected before the report shows any value. After that filtering can be done by Online state, the state of the sensor, the minimum value and the maximum values. The location tree can also be used to filter per site or region. The resulting list can be exported to CSV.
Errors
Show all the sensor in the network that are in ERROR state. That is usually because the sensor is nos answering or is configured incorrectly. This reports helps finding the sensors with problems so remedy actions can be taken
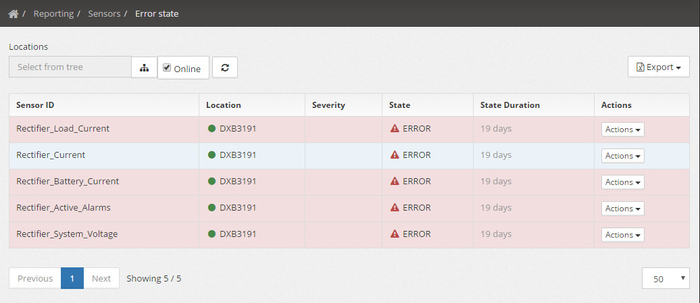
This report is equivalent to the last status report, but filtered for the sensors that are in ERROR state. The location tree can also be used to filter per site or region. The resulting list can be exported to CSV.
System Messages
Shows the system messages for a specific site. Once in the report a site has to be selected, unless the location menu has been used to get to the report.
...
| Info |
|---|
Clicking on the info button shows the values of the message sent, in its original format. |
Event Log
Shows all the historic list of sensor events (or alarms) for a specific site. In the top right corner to total number of events can be seen.
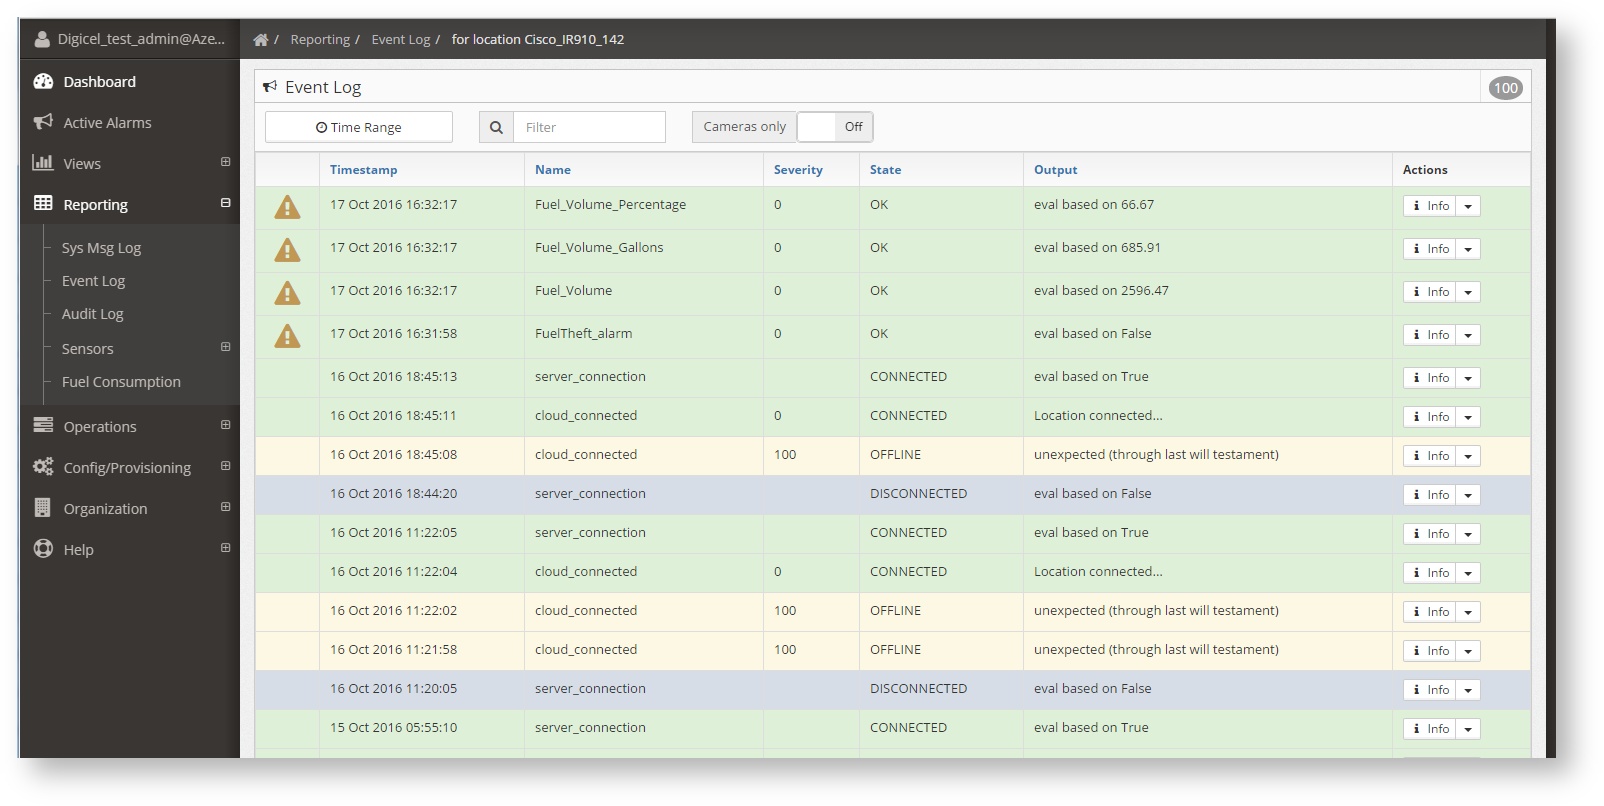
The event list can be filtered by:
- Time Range: To select the time period for which the events will be shown
- Filter: This is a free text filter that is applied to all the fields. Can be the sensor name, the sensor state, the sensor output. Case sensitive.
- Cameras only: Shows only the sensor that have an image associtated. Hovering over the camera icon () shows the picture.
...
User Audit
Shows all the actions that the system users haver performed, suchs as logins, changing configurations, deploying them, triggering remote actions, etc.
...
The list will show all the actions, who performed them, at what time, and the type. Clicking the info button (![]() ) shows more details.
) shows more details.
Sensors
Last Status
Shows the last status of a specific sensor across all sites
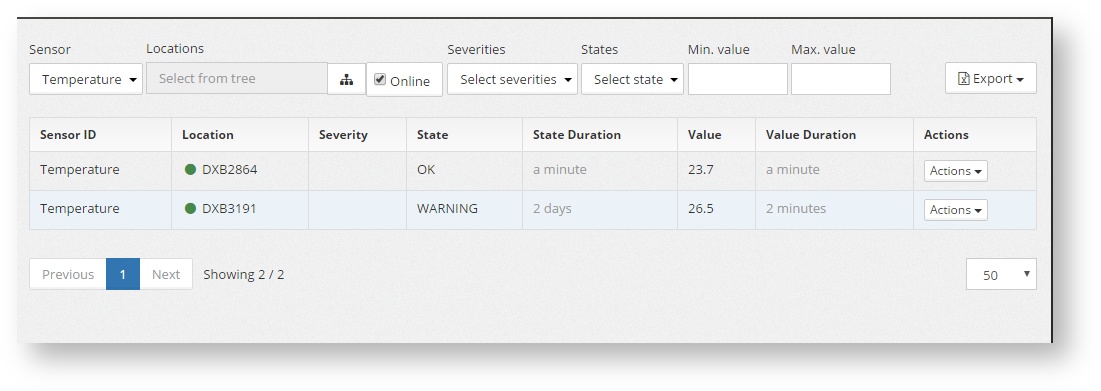
A sensor has to be selected before the report shows any value. After that filtering can be done by Online state, the state of the sensor, the minimum value and the maximum values. The location tree can also be used to filter per site or region. The resulting list can be exported to CSV.
Error state
Show all the sensor in the network that are in ERROR state. That is usually because the sensor is nos answering or is configured incorrectly. This reports helps finding the sensors with problems so remedy actions can be taken
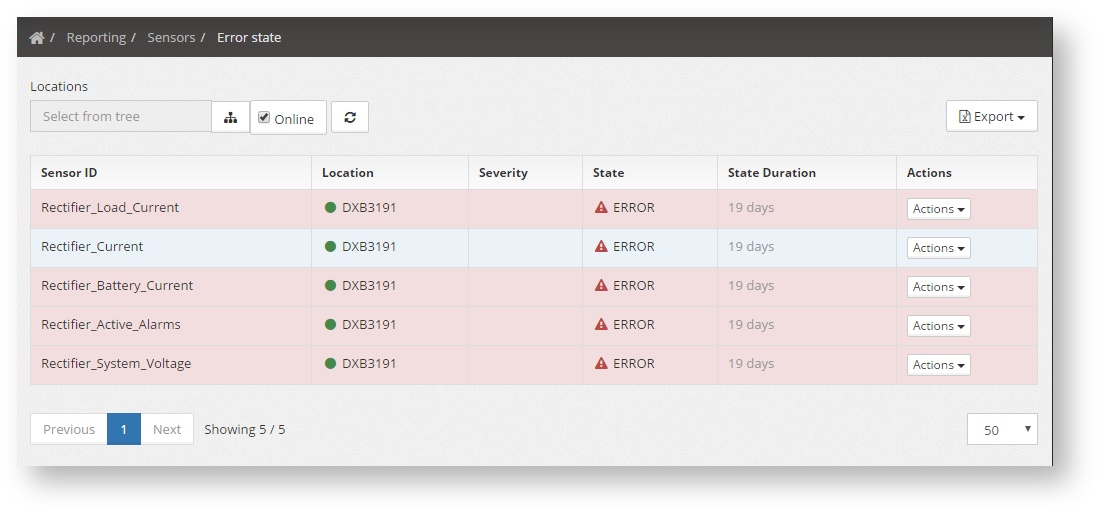
This report is equivalent to the last status report, but filtered for the sensors that are in ERROR state. The location tree can also be used to filter per site or region. The resulting list can be exported to CSV.